Photography cheat sheet: How to read a histogram
We explain how (and why) to use your camera's histogram

Histograms are available on the vast majority of cameras and they are a simple way of looking at the tones in your image. If you've never used a histogram, or you're not quite sure what they're supposed to show, we'll explain more in this article.
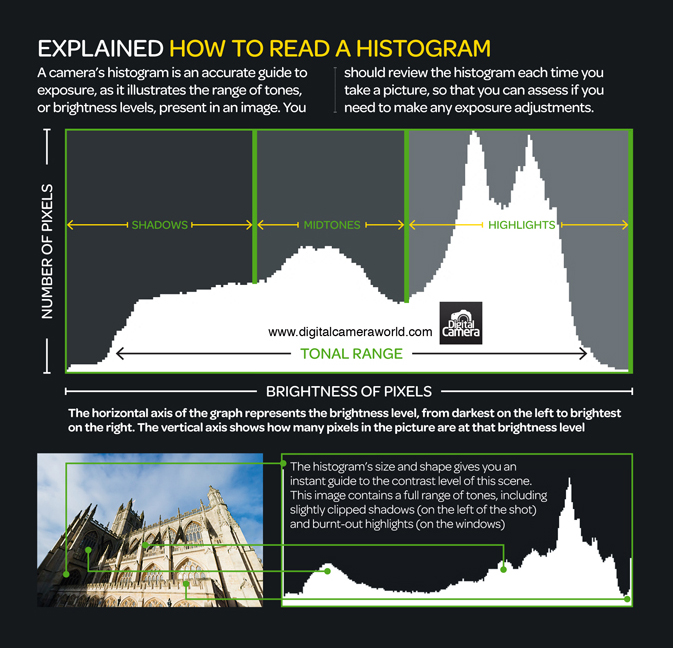
Scroll down to the bottom of this page for a handy photography cheat sheet on how to read a histogram.
What is a histogram?
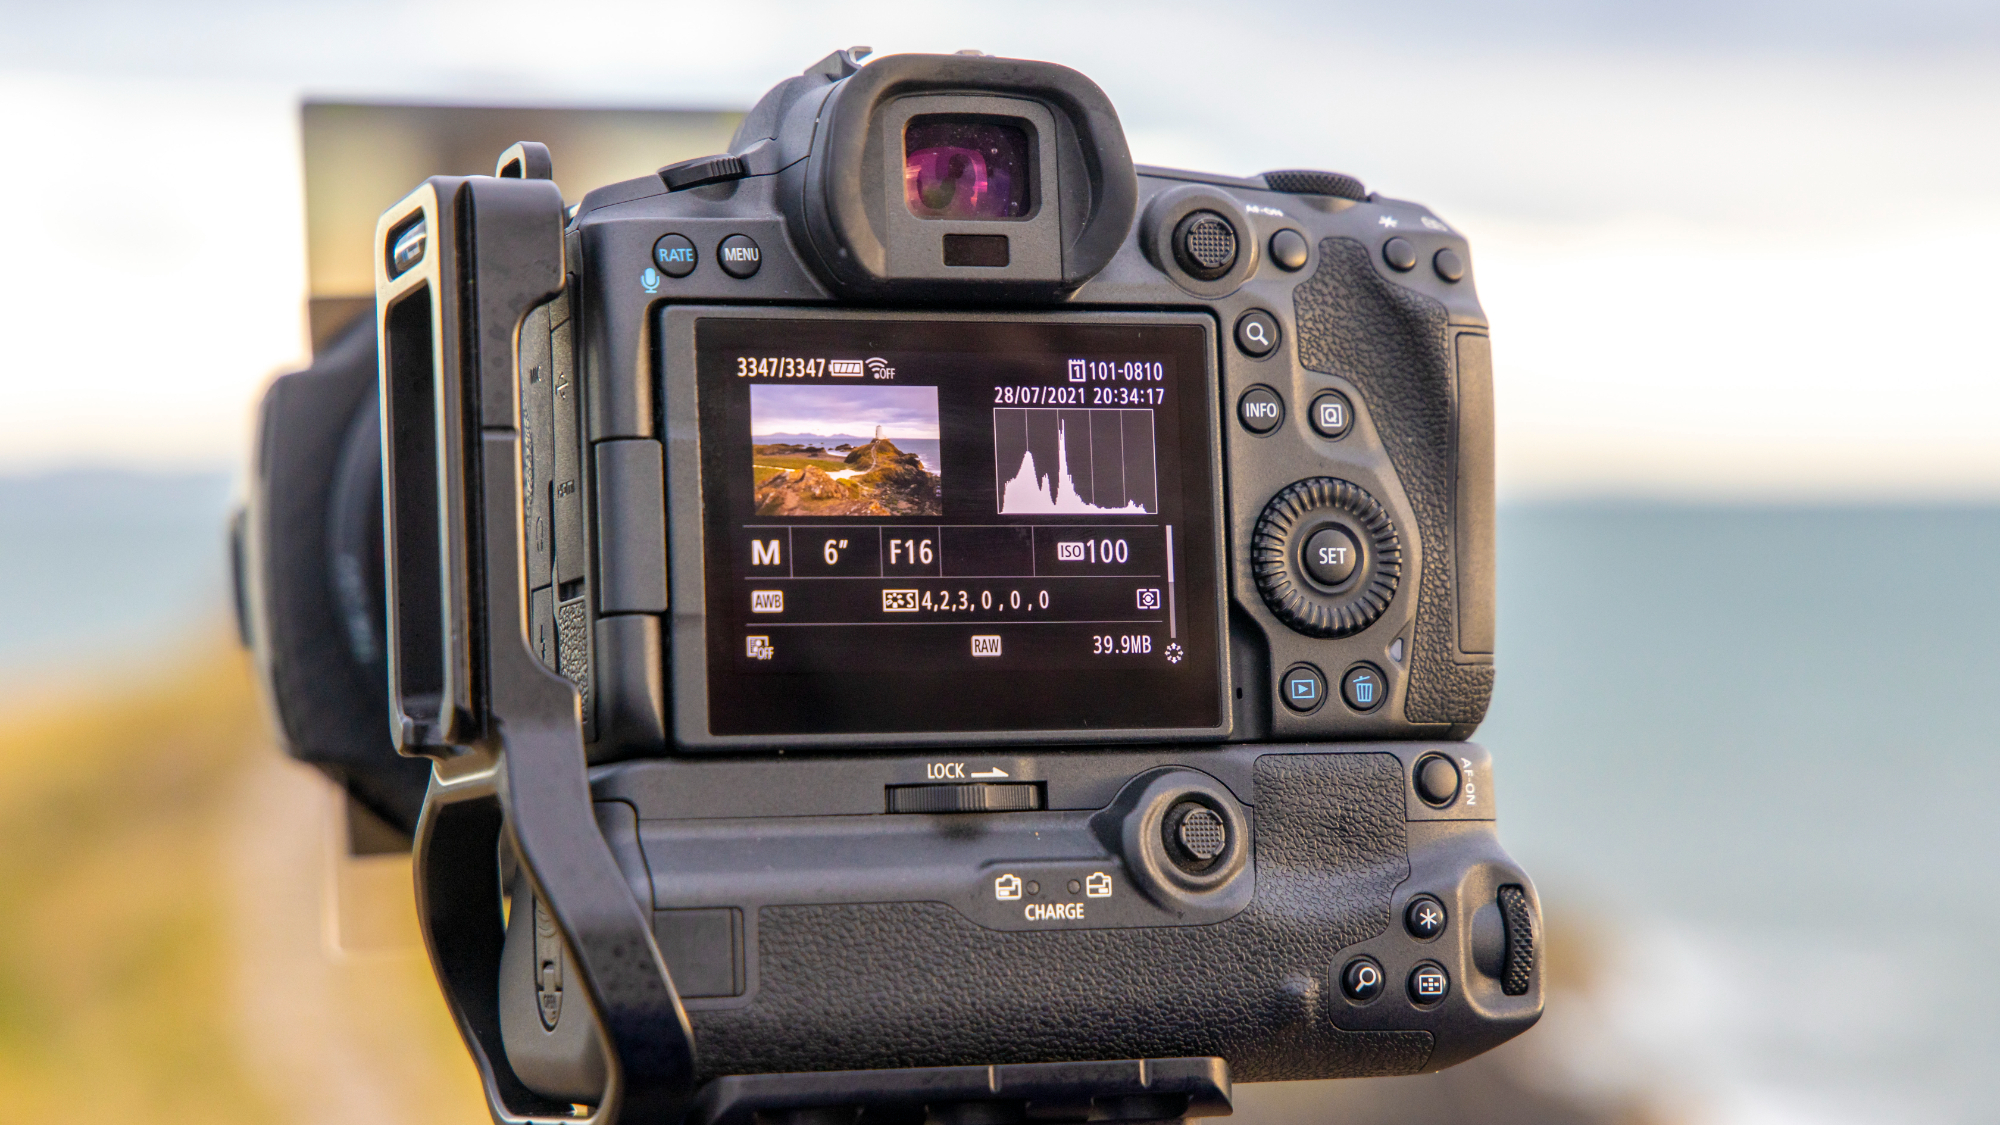
If you own a mirrorless camera or DSLR, it's very likely to have a histogram function – essentially a graph that can be displayed on the LCD screen when you're composing an image using Live View Mode.
A camera's histogram is a graphical representation of the tonal range in your image. In other words, it shows you how much of your scene will record as a shadow, how much as a highlight, and how much in between.
How to read a histogram
The left-hand side of a histogram graph corresponds with shadow detail and the right-hand side with highlights, and you can view this either as you compose your image or afterward when playing back your image (or both).
Usually, this histogram will come up when you press your camera's 'Disp', 'Info', or directional menu-pad buttons, but this may not be the case on your particular camera, so check your manual if you're unsure of how to access this.
Examining the historgram will give you a better idea of two things. The first is the overall exposure. As you adjust your camera's aperture, shutter speed, and ISO, you should see the information within this graph move. As you increase the exposure – such as by using a longer shutter speed or a wider aperture – you should see this move towards the right, away from the left-hand side of the scale. This is because more of the scene will record as a mid tone and highlight, and less as a shadow. Likewise, decreasing the exposure will move this tonal spread away from the highlights and down toward the shadows.
Read more: Cheat sheet – How to understand f stops
With an "average scene", one that naturally contains a varied mixture of highlights, shadows and mid-tones, you'll be aiming to keep this spread so that it fits somewhere in the middle of the scale, and this should give you good exposure. Not every scene is the same, however, which is where the second important thing histograms tell you comes in: how much detail is being recorded and how much is lost.
Once the graph starts to show lots of tonal information bunched up to either side, to the point where it's falling off the edge and reaching the top of scale, details in this region are not being properly recorded. Too much of this on the left-hand side means that it's shadow detail you're losing, and too much on the right will indicate highlights are blowing their details. So, the key is to ensure your chosen exposure settings don't allow this to happen.
What should my histogram look like?
It's important to remember that different scenes will have different histograms, and there's nothing wrong with there being more details on one side than the other. Indeed, if you always try to adjust your exposure to keep everything as much in the center as possible, you'll find that some scenes just don't look right.
For example, if you're out shooting a scene in the snow, you'll probably want more information to be on the right-hand side of the scale, as your scene will be filled with more highlight detail than usual. If you try to squeeze all of this down to the middle of the scale for balance, you'll find that those whites are being recorded more as greys.
Histograms are particularly useful as they are not affected by the brightness of your camera's LCD screen or electronic viewfinder (if your camera has one). Sometimes, raising the brightness of one of these might be necessary in order to maintain a clear view, perhaps when photographing outdoors when it's sunny, but this can make it more difficult to see whether you are giving the scene the right exposure.
What they are affected by, however, are other capture settings you may have chosen, such as contrast or dynamic range optimization settings. If you set a high-contrast capture setting, you'll find that there's more information being recorded in both the shadows and highlights at the expense of mid-tone detail, than if you were to use a more standard contrast setting. Conversely, dynamic range optimization settings may bring highlight and shadow details more toward the middle of the graph to prevent these from being lost.
Photography cheat sheet: how to read a histogram

You might like the rest of our photography cheat sheets and photography tips.
Get the Digital Camera World Newsletter
The best camera deals, reviews, product advice, and unmissable photography news, direct to your inbox!
The former editor of Digital Camera World, "Matt G" has spent the bulk of his career working in or reporting on the photographic industry. For two and a half years he worked in the trade side of the business with Jessops and Wex, serving as content marketing manager for the latter.
Switching streams he also spent five years as a journalist, where he served as technical writer and technical editor for What Digital Camera before joining DCW, taking on assignments as a freelance writer and photographer in his own right. He currently works for SmartFrame, a specialist in image-streaming technology and protection.

