What is a histogram and when would you use it?
Understanding what a histogram is and how to read it will help you get the exposure right in your photos

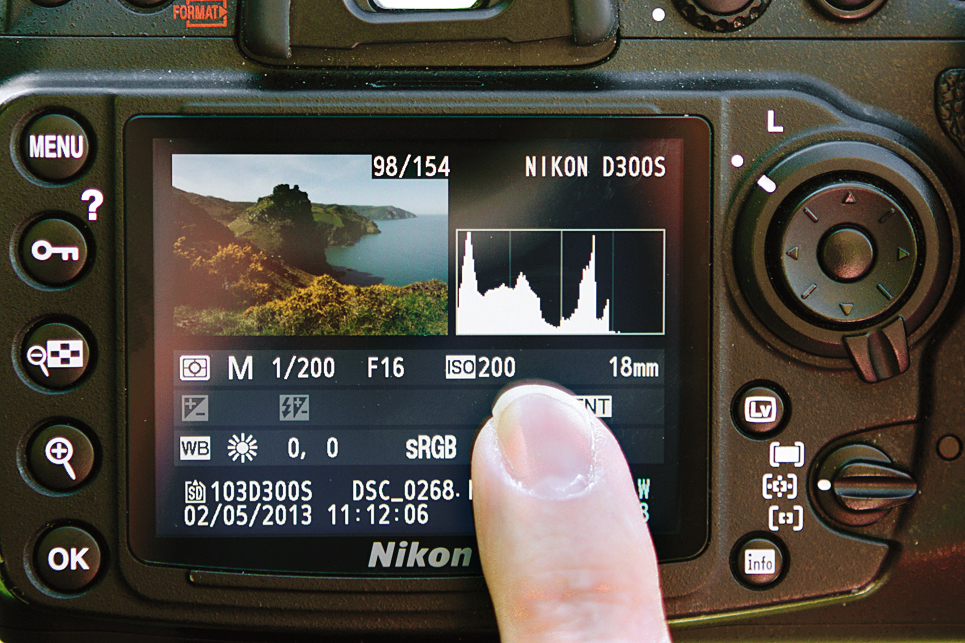
Most modern DSLRS and mirrorless cameras allow you to view a graphical representation of both the tonal variation – which essentially runs from pure black to pure white – and a display of the brightness of the individual colour channels, R (red), G (green) and B (blue), that make up the digital image.
Both histograms can give us valuable information but it is the Brightness Histogram, the one made up of tonal variations of the scene, that’s the most immediately useful, and easiest to read.
Brightness histogram
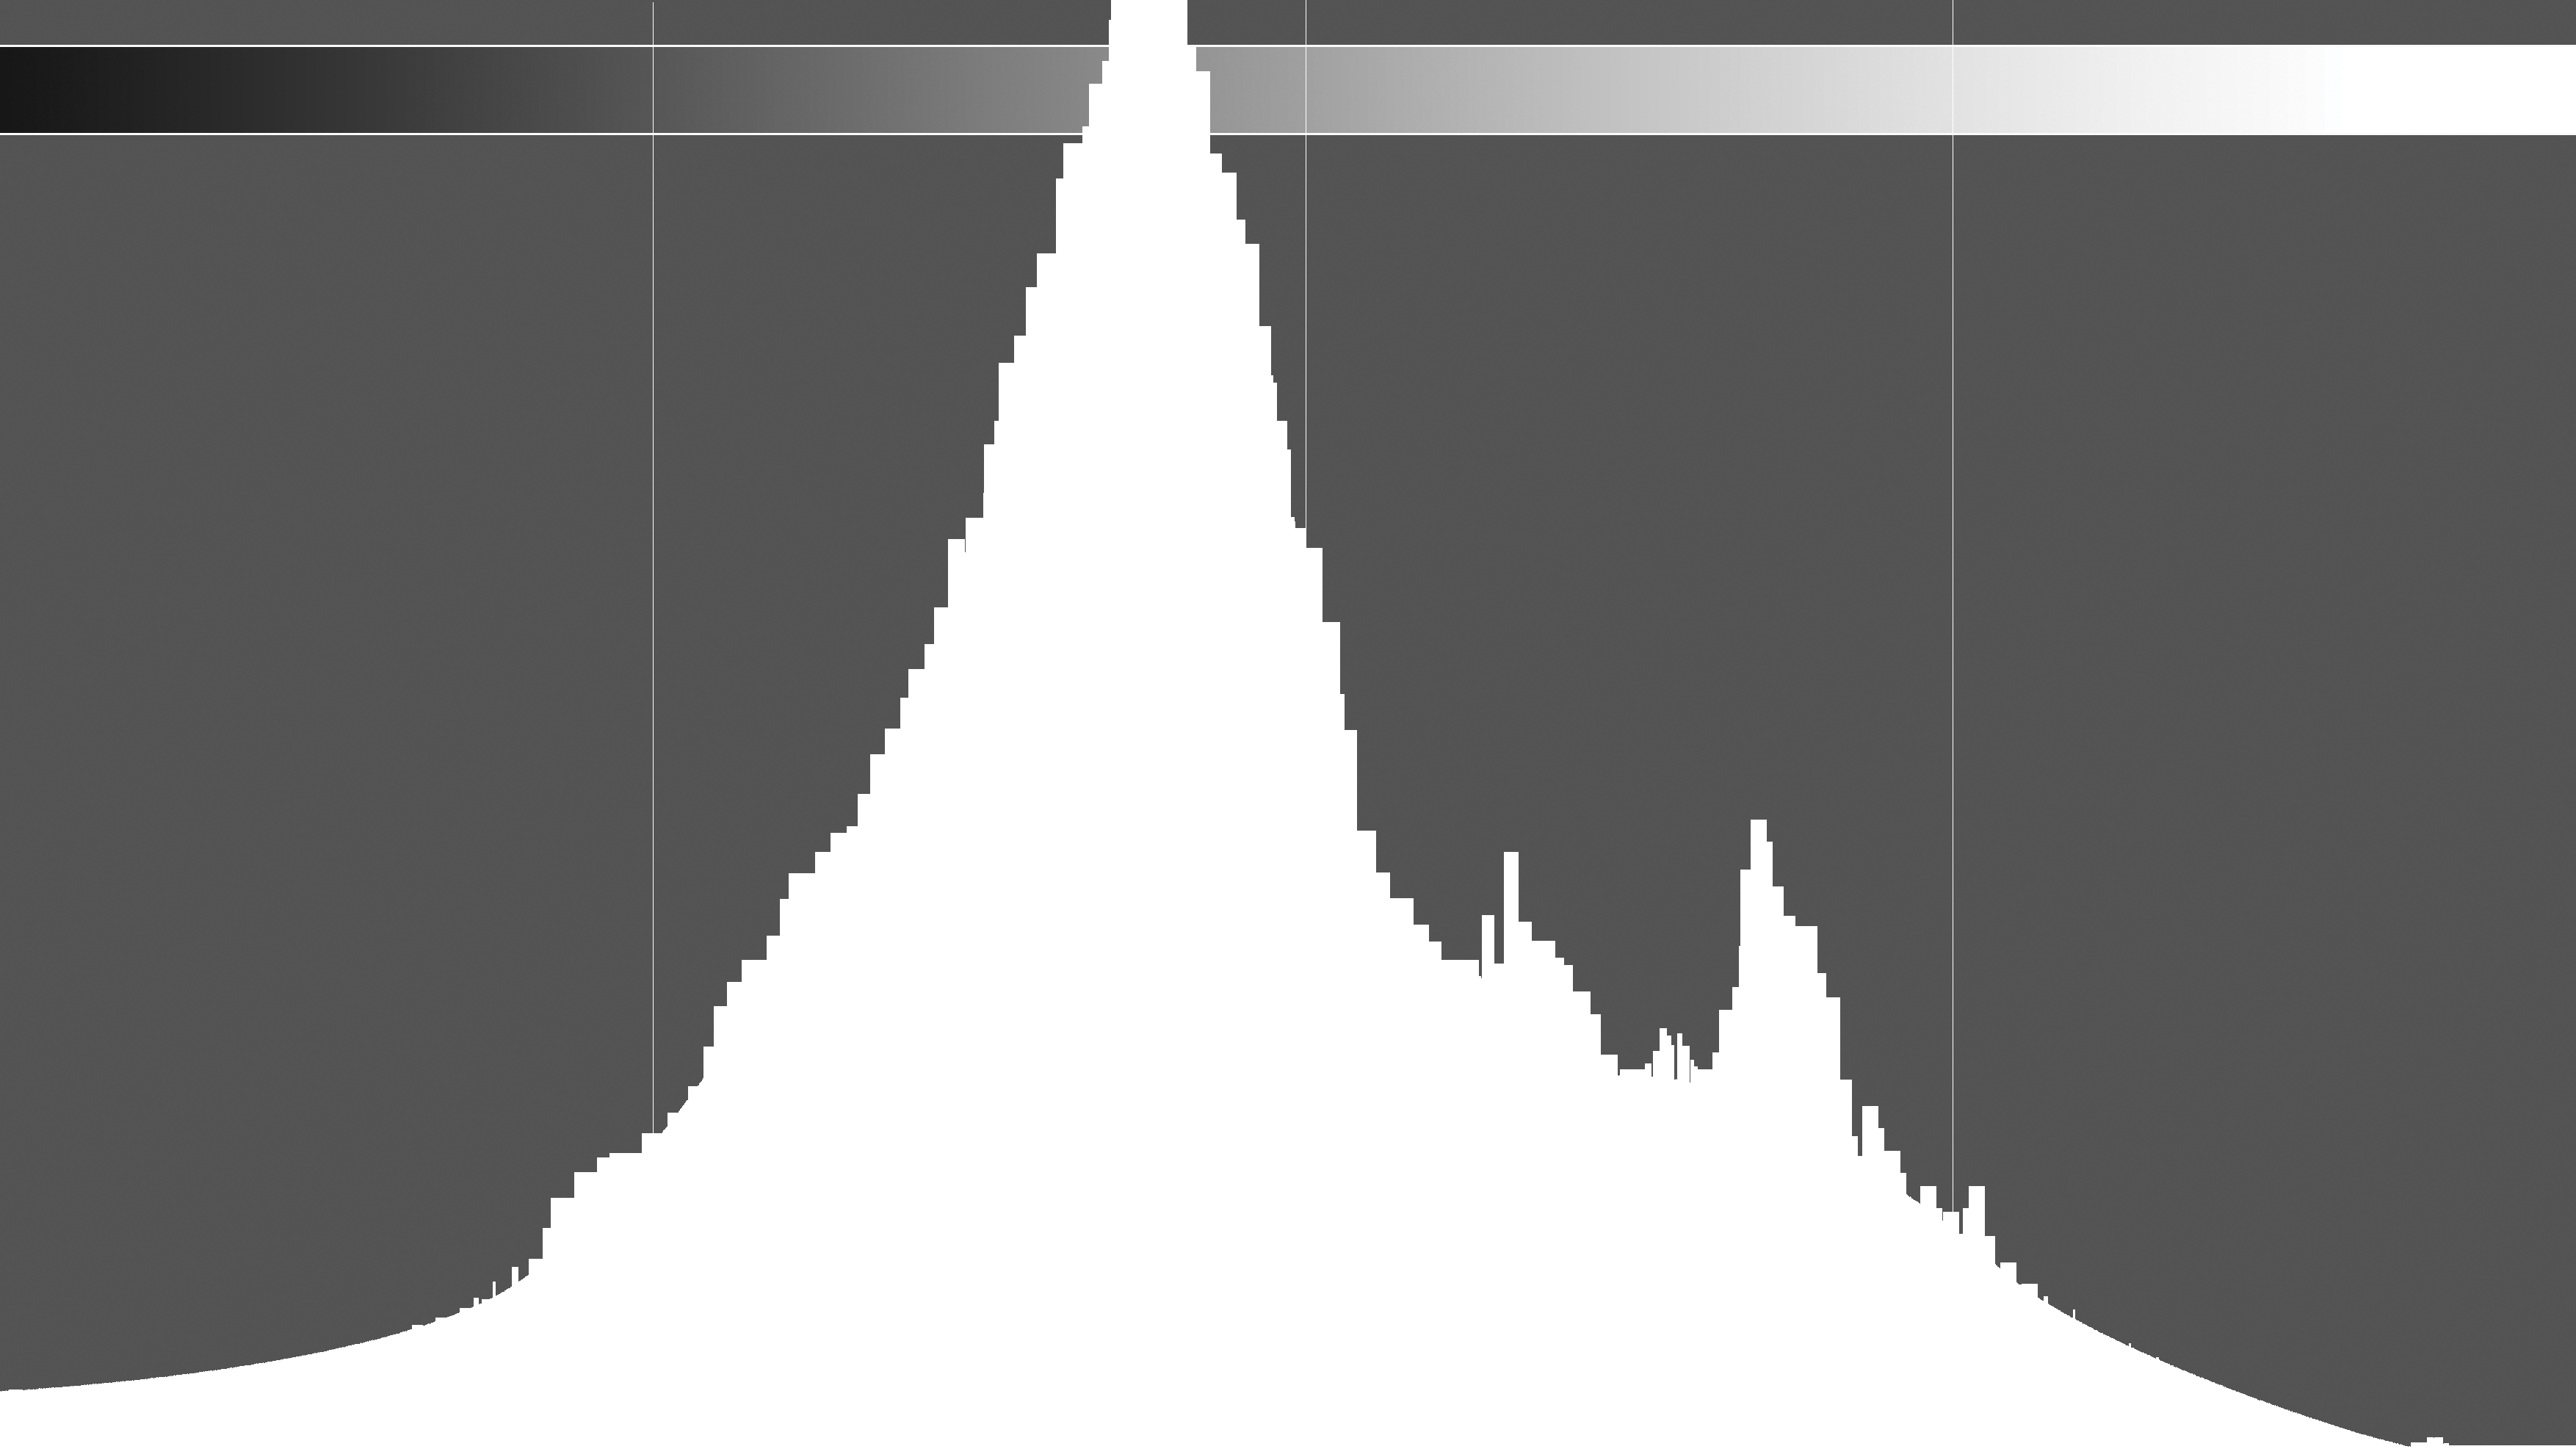
If you select the Brightness Histogram, either after taking a photo, or when you have it displayed while using Live View or an Electronic Viewfinder, you can make judgements on your exposure and decide whether you need to make adjustments. The important thing to remember is that when you look at a Brightness Histogram, the left of the graph shows the Shadows, the middle area the Mid-tones, and the right-hand side displays the Highlights.
The shape of the Histogram is largely unimportant, as the tonal balance within a scene can vary hugely, but what is important is you look at your image on the screen and then check the Histogram to ensure your image isn’t too dark (underexposed) or too bright (overexposed).
In particular, you should be checking for whether any of the extreme tones are touching either edge as this clipping will show if detail is being lost. Highlight clipping is the most important because if you have completely lost all detail in the highlight area then it may be impossible to get it back even when processing a raw file.
Histogram clipping explained
If you are clipping highlights, then you need to use negative exposure compensation to bring the dynamic range of the digital file back within the graph. For example, using -0.3 stop exposure compensation might be all that’s needed to bring the highlights within the histogram, though of course you may need more. You can do the same for shadows clipping, except you would need + (plus) exposure compensation.
While we said earlier that the shape of the histogram isn’t important, that’s not entirely true. A nicely exposed image of an average scene will have a range of tones from Black to White. There are 256 different tones represented with pure black being 0 and pure white 255. Divide that into five segments and you can say that the tonal range is split into blacks, shadows, midtones, highlights, and whites. The vertical axis of the histogram graph is simply representative of the number of pixels at each value. So, if you have ‘peaks’ that run off at the top it doesn’t matter.
The best camera deals, reviews, product advice, and unmissable photography news, direct to your inbox!
You should use the Histogram as an aid to exposure, particularly as a way to check whether you are blowing highlights and losing valuable detail. You can do this alongside using your highlight alert warning, remembering that is only a warning so when you check the histogram you may well see that you are still exposing within the dynamic range of your camera. Don’t become a slave to the histogram but checking it when shooting in tricky lighting will certainly avoid a few exposure mishaps.
Read more:
• Best hand held light meters
• Best photo editing software
• What is exposure compensation?
Andrew makes his living as a photographer, videographer and journalist. For 26 years he was a specialist magazine editor, the last 13 of which were on Practical Photography magazine. A long-time expert in photographic techniques across many disciplines, he's a self-confessed photo generalist, and a font of creative knowledge to capturing just about any subject, although he has a strong leaning to wildlife and travel photography. Andrew's wide-ranging photography experience means he authors the long-running Photo Answers section for Digital Camera Magazine. His work as a journalist, guide and educator dovetails neatly into his commitment to Foto-Buzz - an online subscription community he founded, where Andrew writes articles, films tutorials and records blogs on all manner of photo-related subjects and techniques for enthusiast photographers.


