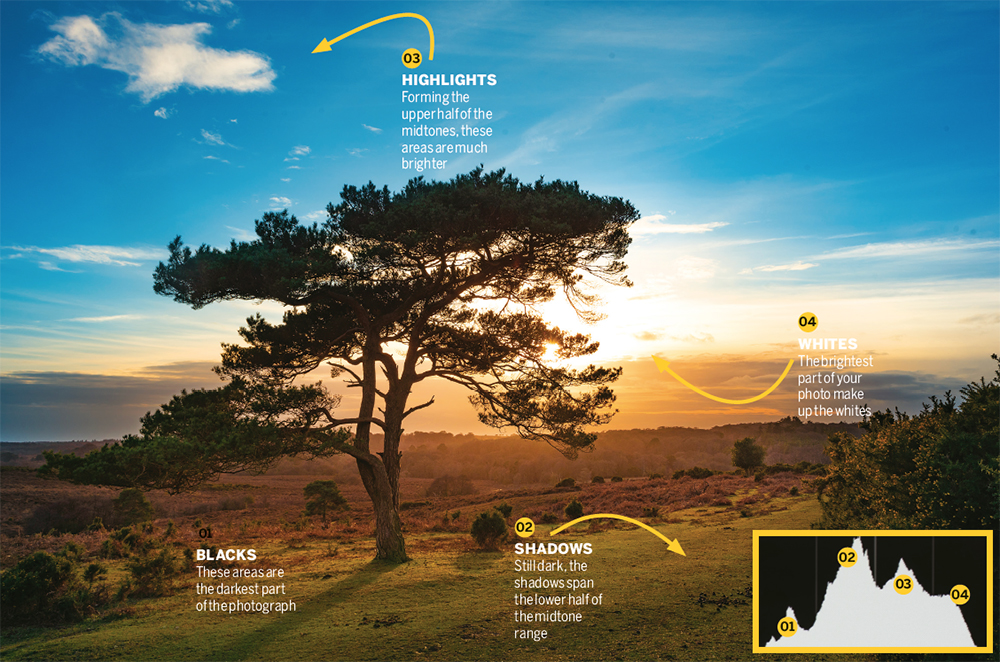
A histogram is a chart that represents a quantity of something over a given range, and in terms of photography we’re talking about quantity of light over a given tonal range (from black to white).
The mission: Learn to read and interpret the histogram on a Nikon camera
Time: One hour
Skill level: Beginner
Kit needed: DSLR or camera with a histogram display
The photographer’s histogram is split into four distinct sections. Going from left-to-right, we see Blacks, Shadows, Highlights and Whites, respectively from darkest to lightest. If you want to view the histogram on a photo you’ve taken, head to Playback display options on your camera and tick the Overview box, then click OK. Then simply open an image you’ve taken. Next, click up or down on the multi-selector until the histogram appears.
Read more: Cheat sheet: How to read a histogram
There’s a common misconception that one should photograph to render a certain shape of histogram. Rather, it works the other way around – by informing the photographer of light and dark presence in a photo.
The two main areas we look at are: is it heavily stacked to one side; and does the data lay against the edge of the graph? If it’s the former, and the subject isn’t necessarily completely dark, or completely light, this may be an exposure issue that we have to rectify.
However, the latter tells us whether there’s any clipping (distortion) occurring in the blacks or whites – under- or overexposure respectively, resulting in lost information.
It’s worth bearing in mind that the histogram you see on the back screen of your camera shows you the tonal range of the JPEG thumbnail only, even if you shoot in Raw.
Your Raw files contain much more data than JPEGs and as such, there’s an acceptable level of clipping that can occur without complete data loss. So let’s learn what histogram shapes tell us about our photos.
1. Symmetric histograms (unimodal)
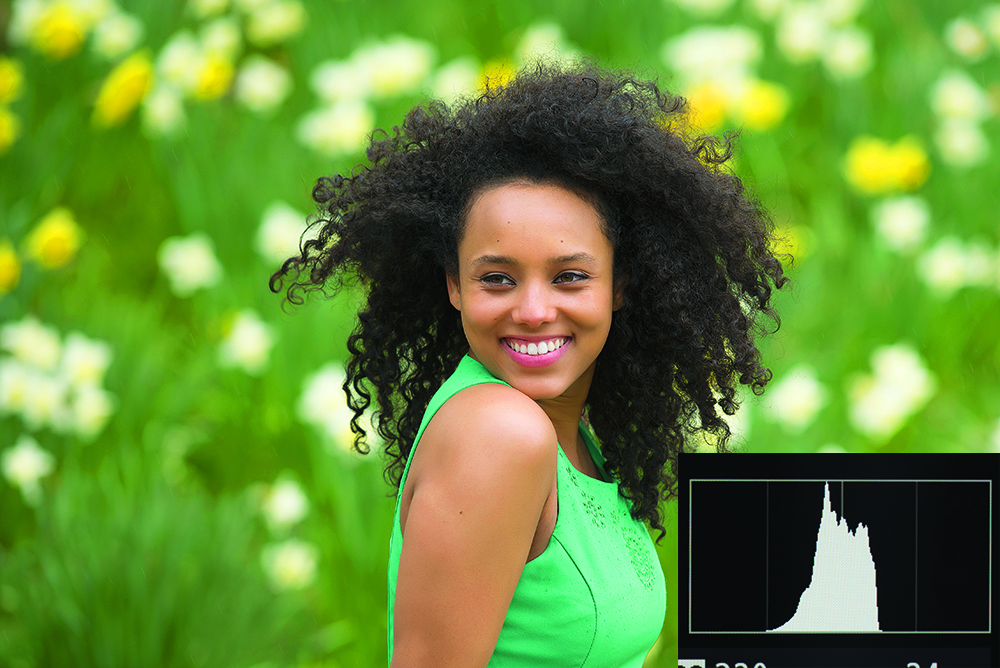
This looks like a bell-curve as it raises gradually in the middle. This type of image has no deep shadows or bright highlights, which is commonly seen with soft, even lighting, against subjects of low contrast, as you can see above in this portrait taken on an overcast day.
2. Positive Skew
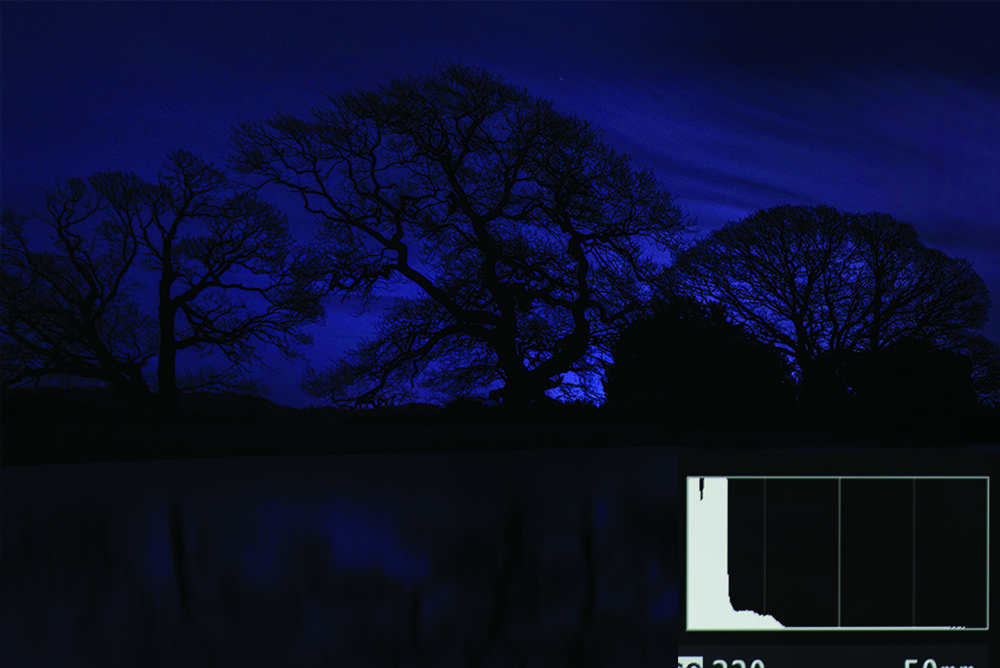
A histogram steeped to the left means plenty of darker tones, and that’s what we want to see if photographing dark subjects, or shooting at night. However, if, in reality, you notice the scene is actually quite bright then you’re likely underexposed.
3. Negative Skew
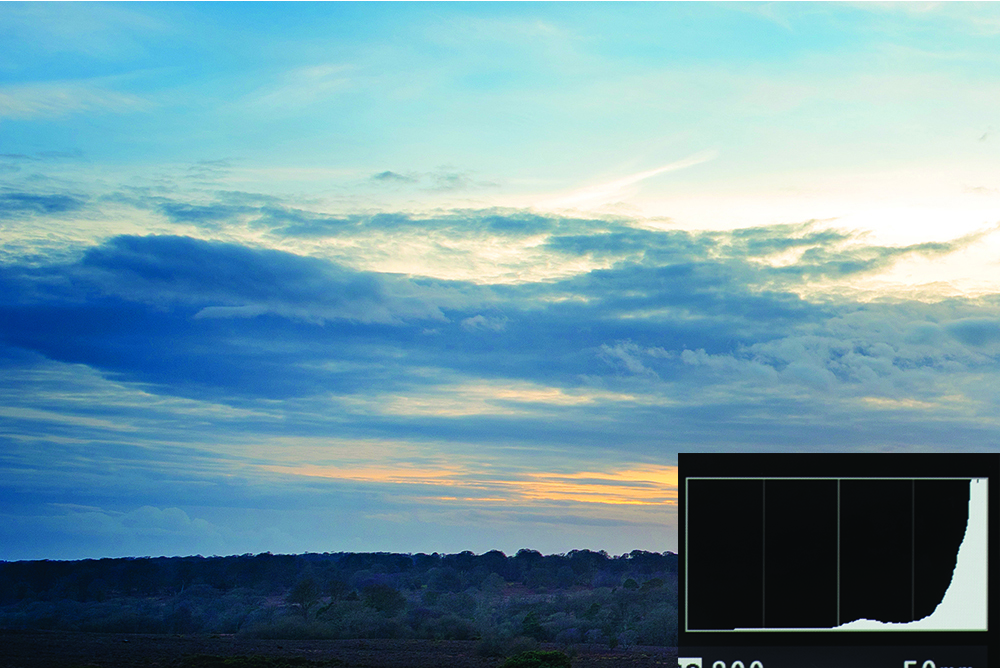
Steeping to the right tells us the scene contains plenty of bright areas, such as a snowy scene, photos with plenty of sky included in the shot, or a bride in a wedding dress. However, it could mean overexposure if the scene or the subject isn’t naturally bright.
4. Bimodal
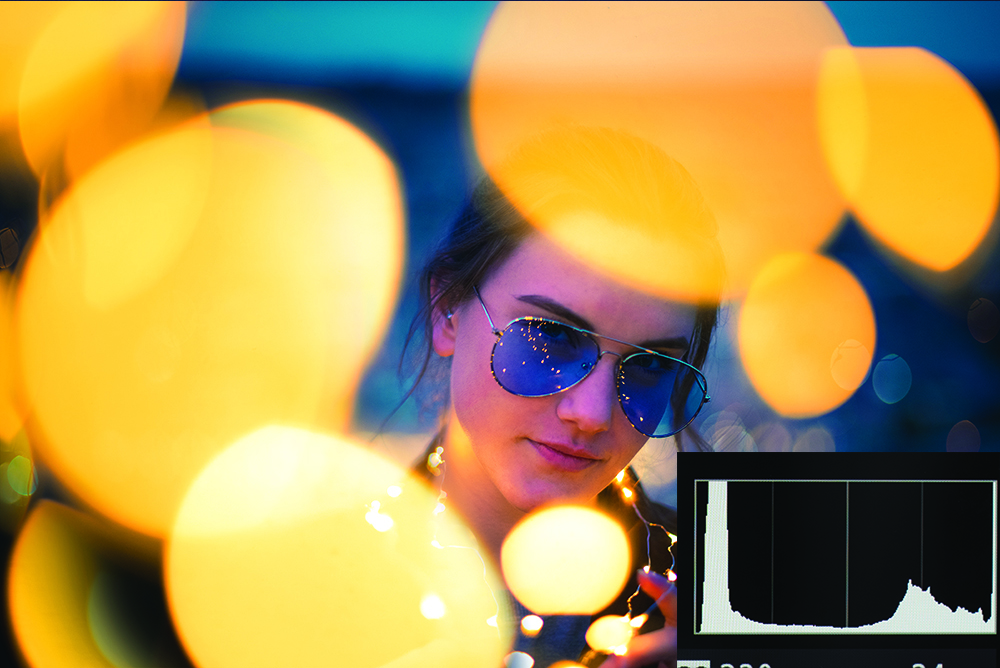
As the name suggests, there are two distinct peaks in the histogram reading. This can be a result of a subject having dark and light areas, such as landscape on a sunny day with no clouds, or with comparatively bright off-camera lighting for a portrait.
5. Multimodal

This histogram occurs when there’s lots of exposure detail randomly placed throughout the scene, with no particular bias towards one area of the graph. It doesn’t tell us much about the image, only that there’s a lot of tonal values throughout the frame.
6. Engage highlights

In the Playback display options menu tick the Highlights box and then click OK. Once you’ve done that, open a photo and press up or down on the multi-selector. Any clipped highlights will now flash, making it easy to spot clipping issues in your images.
7. Check your colors
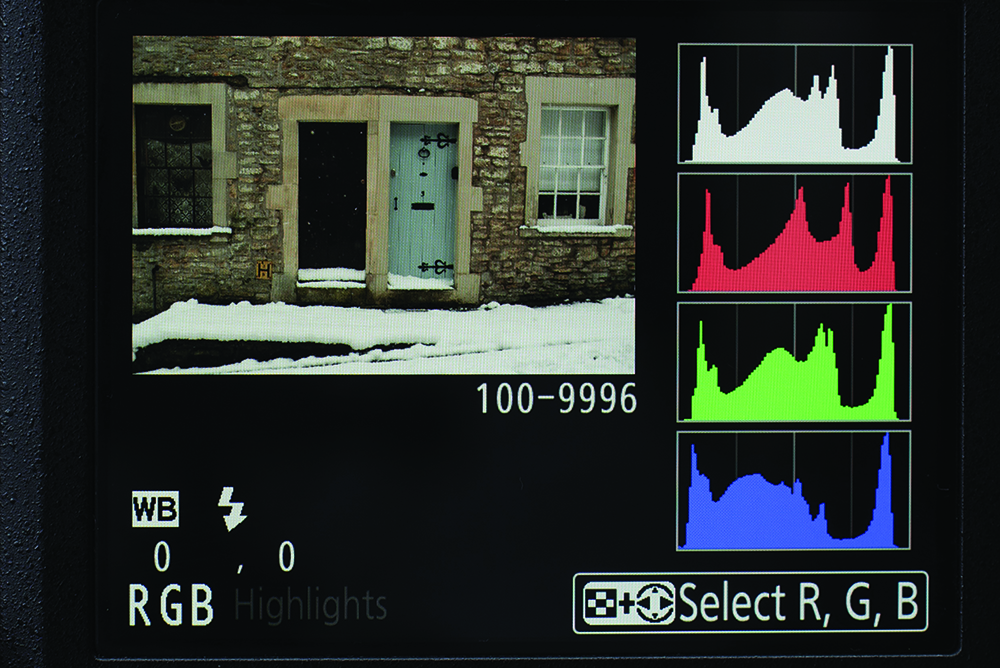
Engage the RGB histogram in the Photo shooting menu to view the red, green and blue color channels, which can help to identify chromatic distortion, useful for important shoots where color reproduction is imperative.
Read more:
Cheat sheet: How to read a histogram
10 awesome newborn photography tips
What is focus peaking?
How to get the best camera set up to take perfect black-and-white images
Get the Digital Camera World Newsletter
The best camera deals, reviews, product advice, and unmissable photography news, direct to your inbox!
N-Photo: The Nikon Magazine is a monthly publication that's entirely dedicated to Nikon users. As a 100% independent magazine, you can be assured of unbiased opinion from a trustworthy team of devoted photography experts including editor Adam Waring and Deputy Editor Mike Harris.
Aimed at all users, from camera newcomers to working pros, every issue is packed with practical, Nikon-specific advice for taking better photos, in-depth reviews of Nikon-compatible gear, and inspiring projects and exciting video lessons for mastering camera, lens and Photoshop techniques.
Written by Nikon users for Nikon users, N-Photo is your one-stop shop for everything to do with cameras, lenses, tripods, bags, tips, tricks and techniques to get the most out of your photography.

