I finally learned to use my camera's histogram and stop trusting its EVF – my photography has improved tenfold
Ever wondered how to read a histogram but been too intimidated to find out? It's a lot easier than you might think
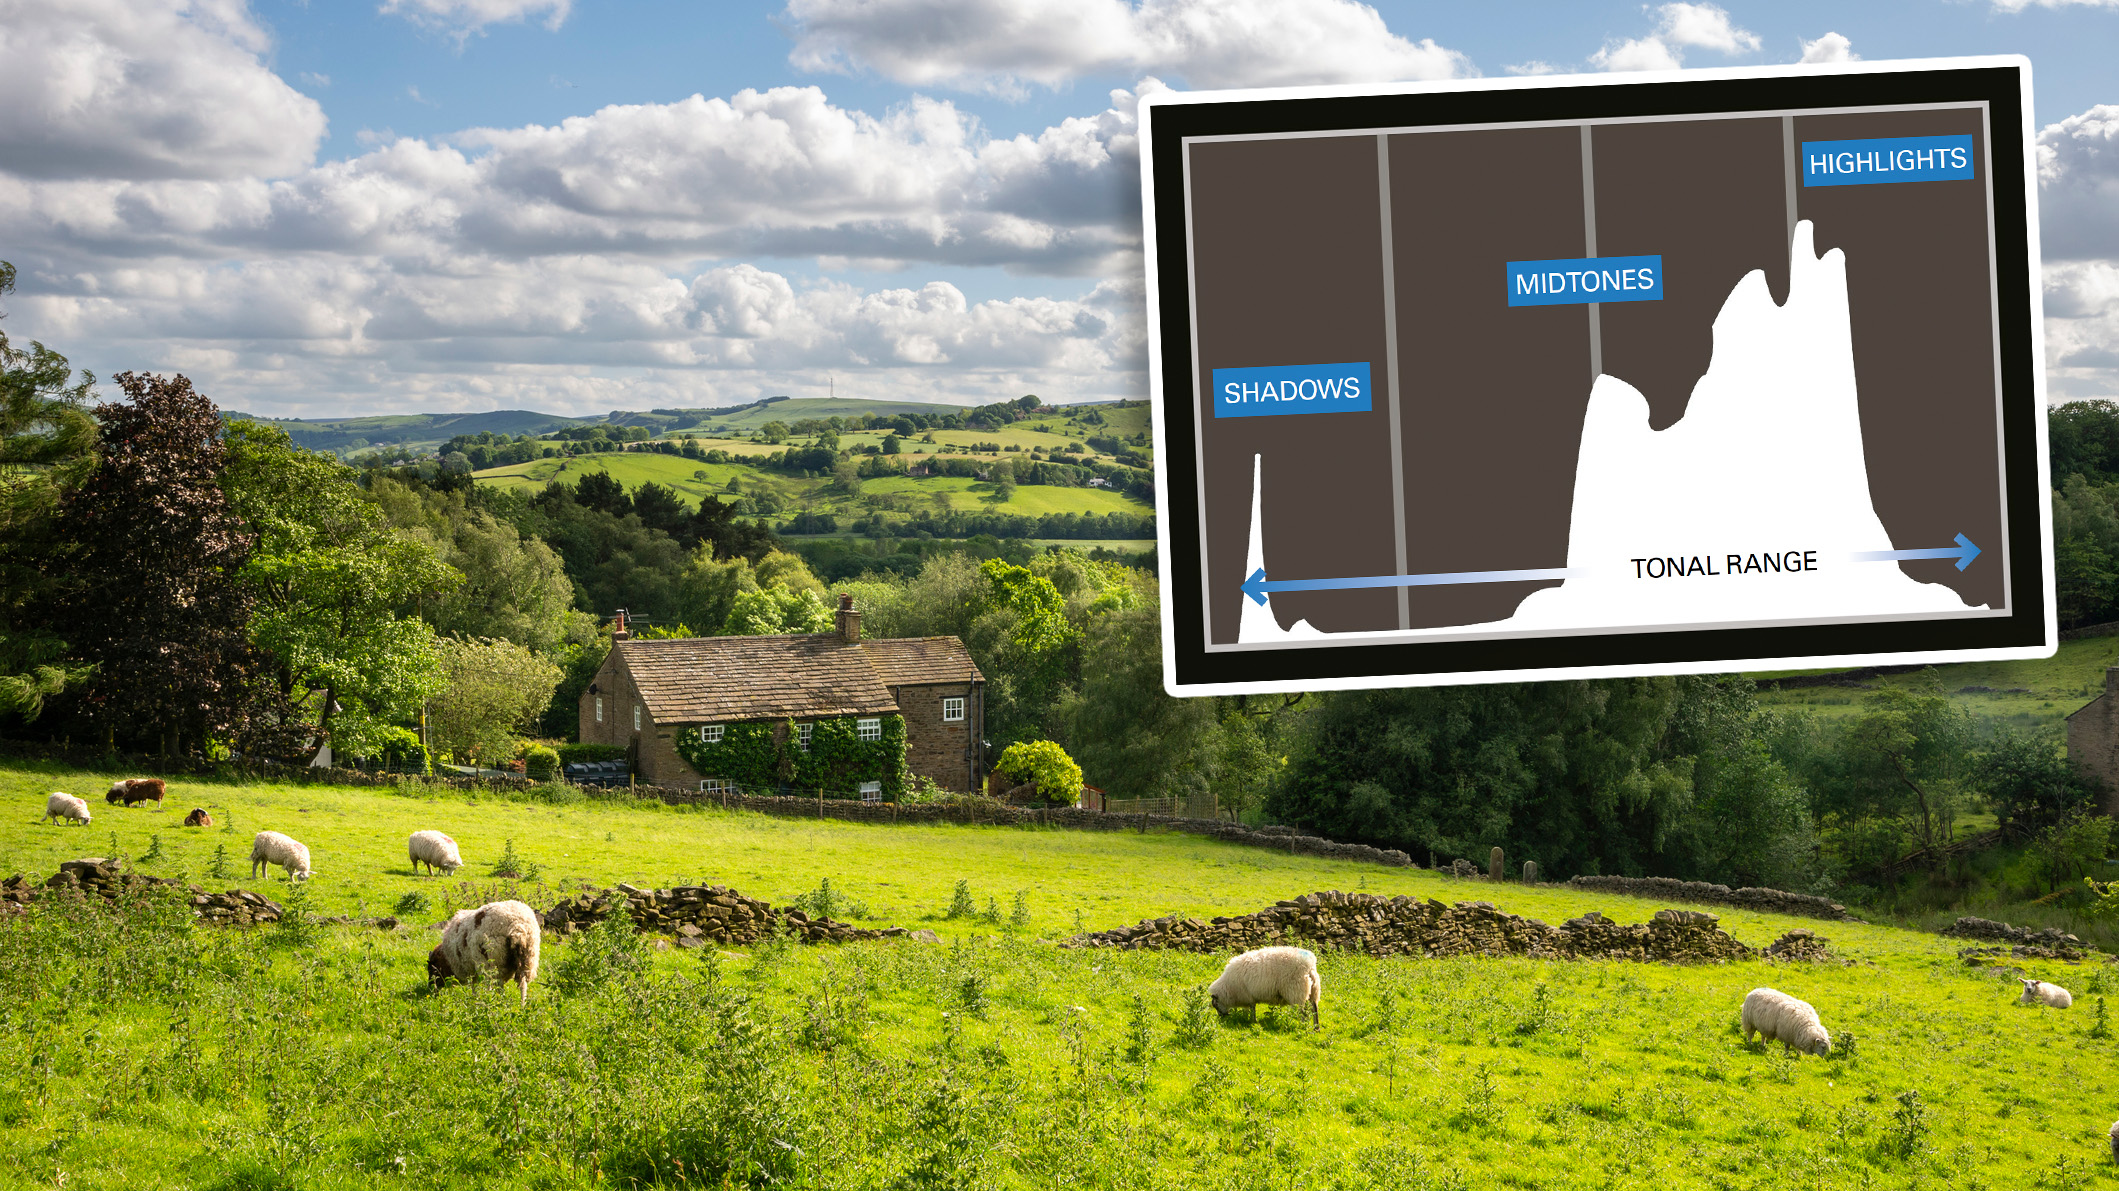
The best mirrorless cameras boast vibrant electronic viewfinders and high-resolution rear LCD screens, which allow you to adjust your exposure settings and watch as they affect live view in real time. And while this has revolutionized how new photographers learn the exposure triangle, just because these electronic screens are bright and detailed doesn’t mean they’re accurate. The same can be said for the best DSLR cameras and their built-in light meters. And that’s where histograms come in.
Histograms typically come in two flavors: luminosity and RGB. The luminosity histogram is generally the more commonly used because it measures total brightness and can therefore be used to keep tabs on your exposure, which is what I’ll be discussing here. An RGB histogram measures the intensity of three different color channels, red, green, and blue.
A histogram is a graph that provides a visual representation of your exposure. DSLR and mirrorless cameras allow you to display some form of histogram, be it an overlay on the live view rear LCD or EVF, or on the playback screen when you preview the images you've captured.
Different manufacturers access the histogram in different ways. Most Nikon cameras and Sony cameras require you to press the DISP button repeatedly to cycle through various overlays, whereas Canon cameras tend to use the INFO button. Your camera's menu system will probably allow you to display the histogram, too, but if you're struggling to find it, consult your camera's manual.
I can split my photography journey into two distinct eras, when I didn’t know how to use a histogram and when I did. By the end of this article, you’ll be able to glance at your histogram and instantly tell whether the image is underexposed, overexposed, or a balanced exposure. And trust me, your photography will be all the better for it.
Why do I need to use a histogram?
We all know that rear LCD screens have their problems. The most notable is glare impeding your view of the display. But electronic viewfinders aren’t perfect, either. Previews are fed directly from the camera’s sensor, and while this sounds like it should be perfectly accurate, it doesn’t matter how precise the data being fed to the display is, variables such as resolution, contrast ratio, color accuracy, brightness, etc, will ultimately affect what you see. It’s no different than viewing the best monitors for photo editing.
Rear LCD screens tend to be about three inches in size and while EVFs are perceptively much larger, neither experience can be compared to viewing RAW files on a computer screen or using the best on-camera monitors. Sometimes the image you’re viewing is just too small for you to easily tell if a particular portion of the image is overexposed.
Another trick is to capture an image and view it after the fact in playback. But aside from all the aforementioned problems, what you’re viewing here is a JPEG image, not a RAW file. So, some post-processing has already taken place, once again, skewing the accuracy of what you're viewing. The histogram removes the inconsistencies that plague previews because it removes the variables by delivering the data in a chart.
How do I read a histogram?
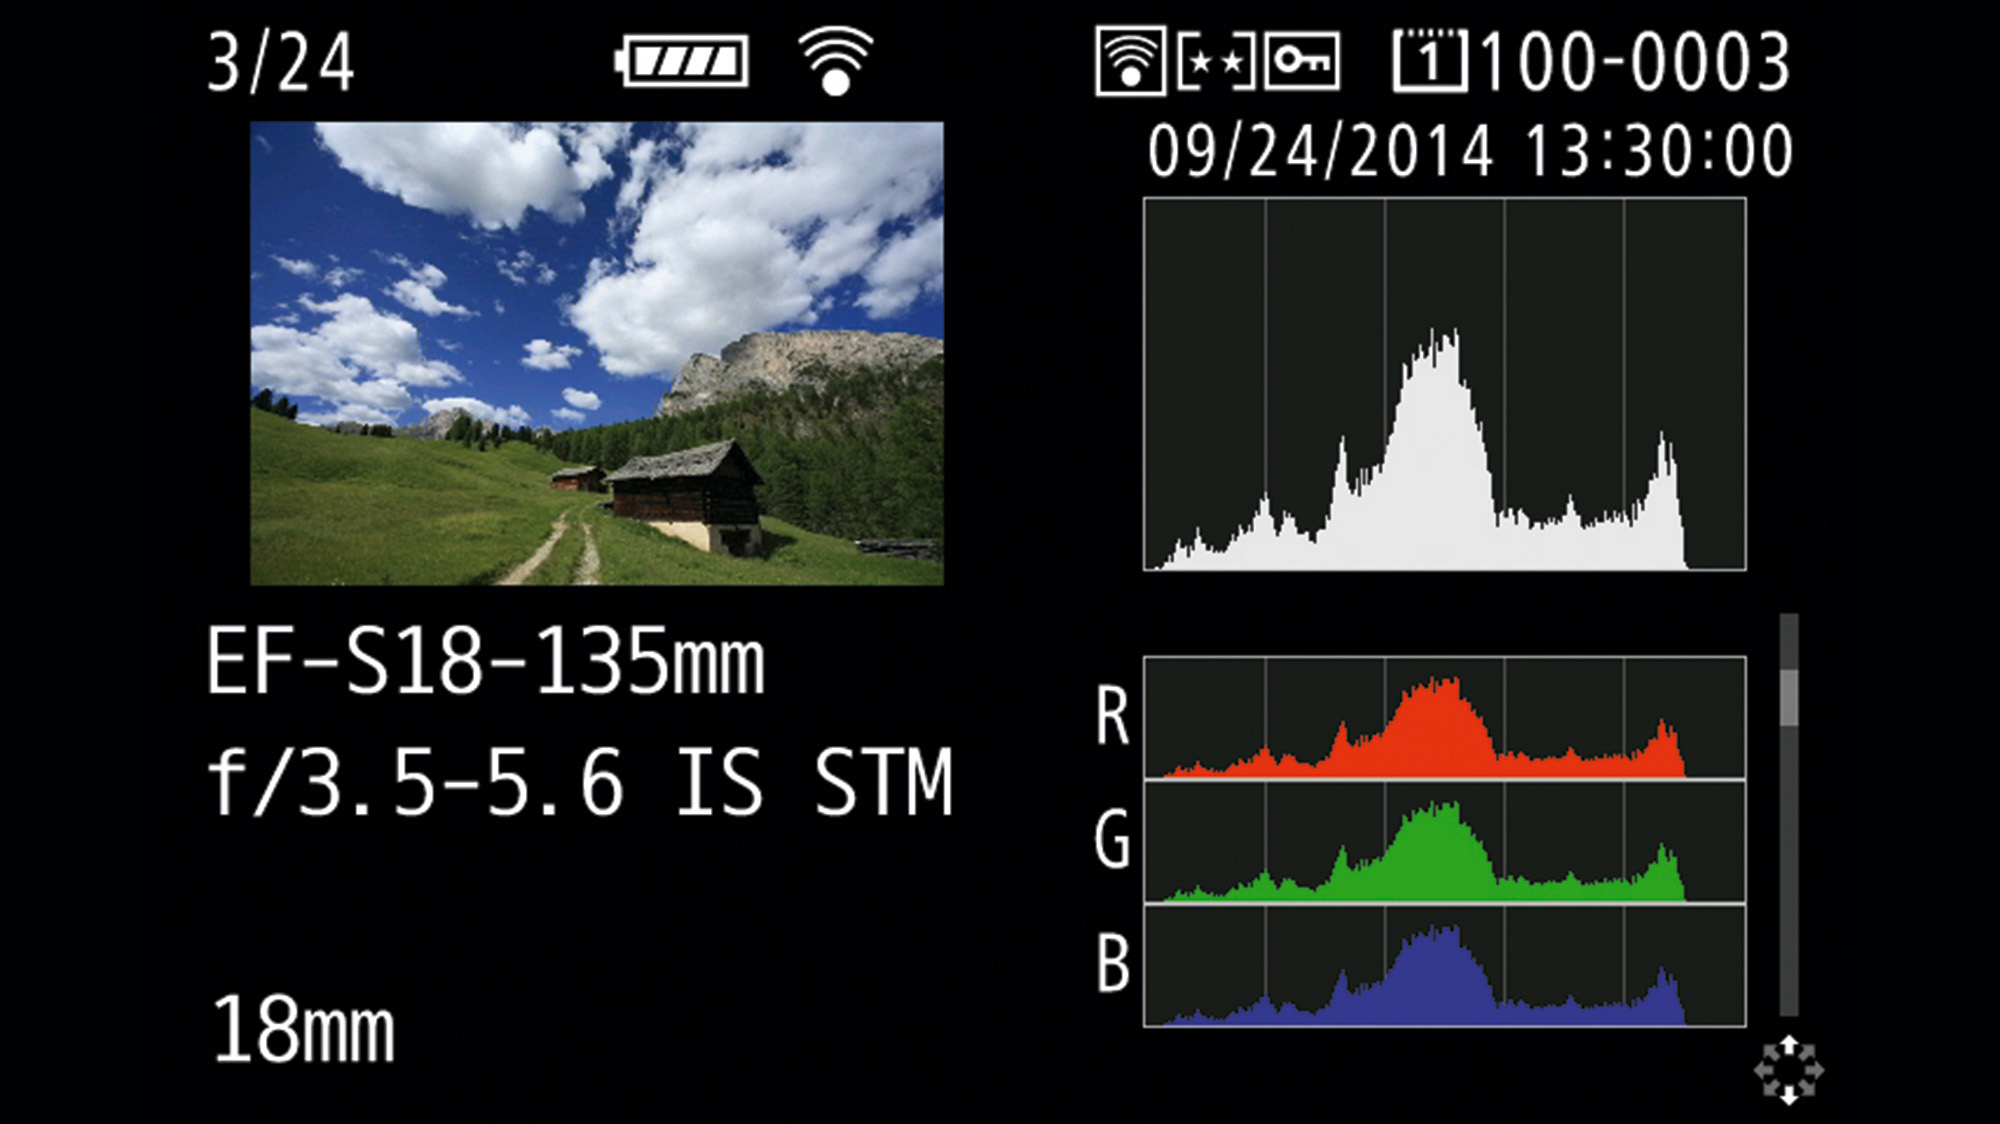
If you don’t know anything about histograms, they can seem a little daunting. But in reality, it’s extremely easy. When it comes to the horizontal axis, the farthest left is pure black and the farthest right is pure white, with that in mind, the left portion of the graph represents the shadows, the middle represents mid-tones and the right represents highlights. The vertical axis charts how many pixels are affected, so if you captured an image that’s very bright, not only would the graph be weighted towards the right-hand side, but it would show a notable peak here, too.
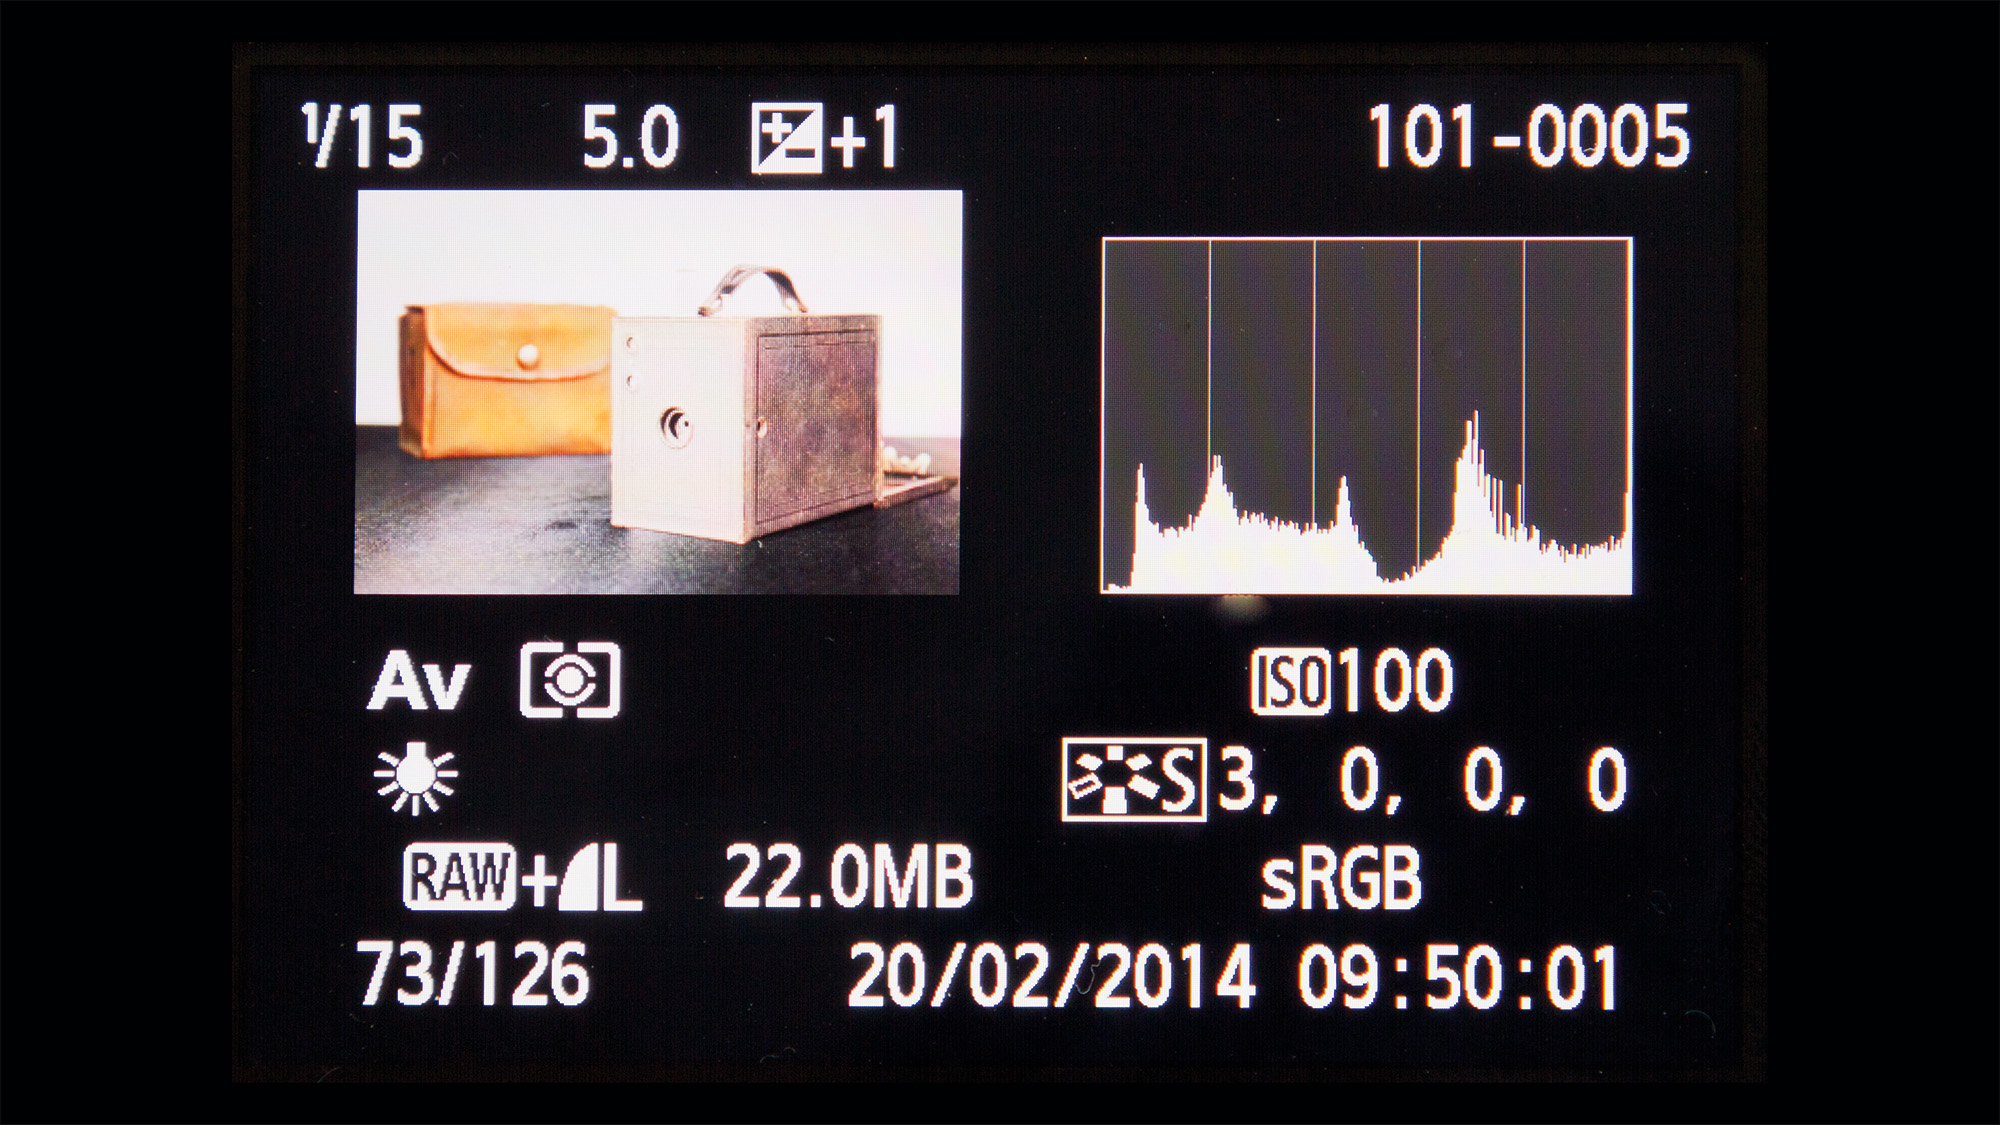
If the graph touches either the far left or far right edge, it means that the image includes a portion of pure black or white, which indicates clipping (a loss of data that cannot be retrieved in post). And while you typically want to avoid large amounts of clipping, do be aware that in some instances some clipping is fine. If you’re shooting against the bright sun, for example, some clipped highlights are inevitable. And if you’re shooting a high-contrast street scene that’s full of deep shadows, clipped shadows will also be acceptable.
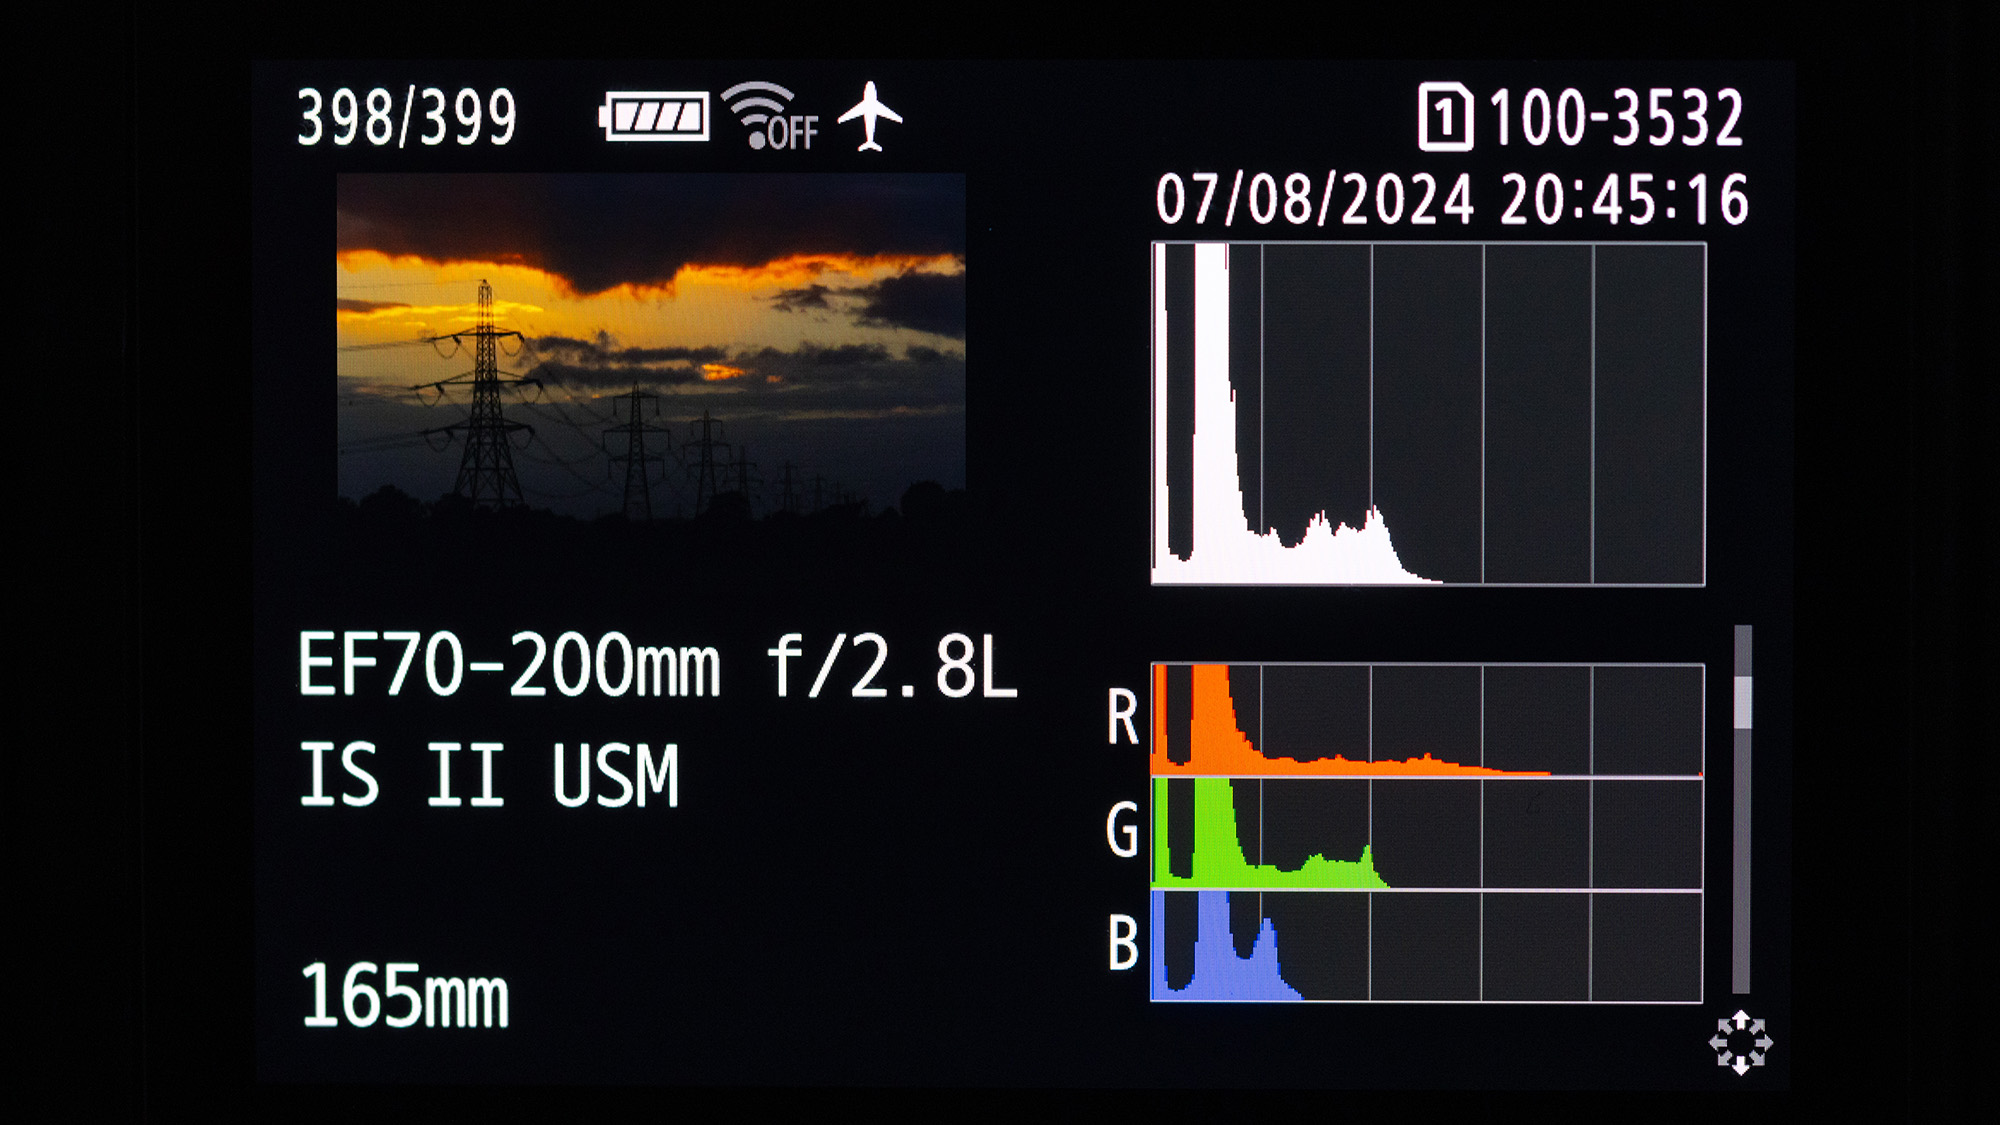
All this means the histogram will change dramatically depending on what you’re photographing, so there’s no definitive graph that you’re trying to achieve. However, to help you get used to reading your histogram, read the captions of the images (Above) which show histograms being used with real-world examples.
Why you shouldn’t trust a histogram implicitly
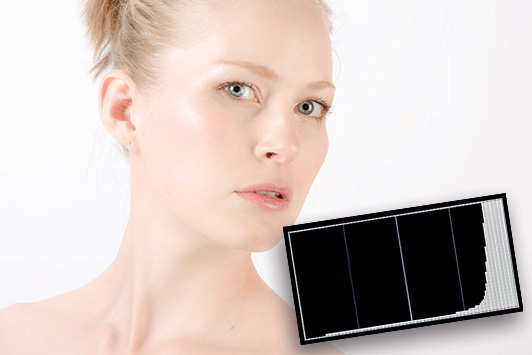
Exposure isn’t an exact science, it’s yet another variable within your photographic arsenal you can use to convey your vision. And it might vary depending on what you’re shooting. For example, if you’re photographing a dramatic, overcast landscape, with soft lighting you’re probably going to end up with a fairly balanced exposure that’s weighted towards the middle. If you’re photographing a portrait of a bride against a bright, sunny background and you expose for her face, the wedding dress and background will be overexposed. This will cause the histogram to be weighted towards the highlights (right) and display some clipping, but so long as the bride’s face is exposed correctly, this would be a perfectly acceptable exposure.
The key takeaway here is to read your histogram and apply it to the scene that you’re photographing. Don’t be afraid to question it. And by all means, use it in conjunction with any other exposure tool you have available, be it an EVF, your camera’s in-built light meter, or one of the best light meters. Take the time to learn how to read it and it'll soon become second nature.
You might also like...
If you want to know more about using a histogram in a practical scenario, you can learn to capture amazing landscape photography by using your camera's histogram.
If all this talk of exposure has left you scratching your head, why not take a step back and learn about five factors that affect exposure in photography?
Get the Digital Camera World Newsletter
The best camera deals, reviews, product advice, and unmissable photography news, direct to your inbox!

Mike is Digital Camera World's How To Editor. He has over a decade of experience, writing for some of the biggest specialist publications including Digital Camera, Digital Photographer and PhotoPlus: The Canon Magazine. Prior to DCW, Mike was Deputy Editor of N-Photo: The Nikon Magazine and Production Editor at Wex Photo Video, where he sharpened his skills in both the stills and videography spheres. While he's an avid motorsport photographer, his skills extend to every genre of photography – making him one of Digital Camera World's top tutors for techniques on cameras, lenses, tripods, filters and other imaging equipment – as well as sharing his expertise on shooting everything from portraits and landscapes to abstracts and architecture to wildlife and, yes, fast things going around race tracks...
