RGB histograms: pro tips for perfect colors every time
Learn how to use the RGB histogram graph in your camera to check the color saturation and gradation of your photographs
Watch the video: RGB histogram photography tips
The histogram is a graph on your LCD showing the distribution of each primary color’s brightness level in the image (RGB or red, green, and blue). The horizontal axis indicates the color’s brightness level (darker on the left and brighter on the right), while the vertical axis indicates how many pixels exist for each color brightness level.
The more pixels on the left, the darker and less prominent the color. And the more pixels there are toward the right, the brighter and denser the color. If there are too many pixels on the left, the color info will be lacking. If there’s too many on the right, the color will be too saturated.
• Read more: Photography tips
By checking the image’s RGB histogram, you can see the color’s saturation, gradation condition and white balance inclination more accurately. You can view the RGB histogram alongside the Brightness histogram and a thumbnail of the image by cycling through your camera's info screens when you’re reviewing images on the LCD.
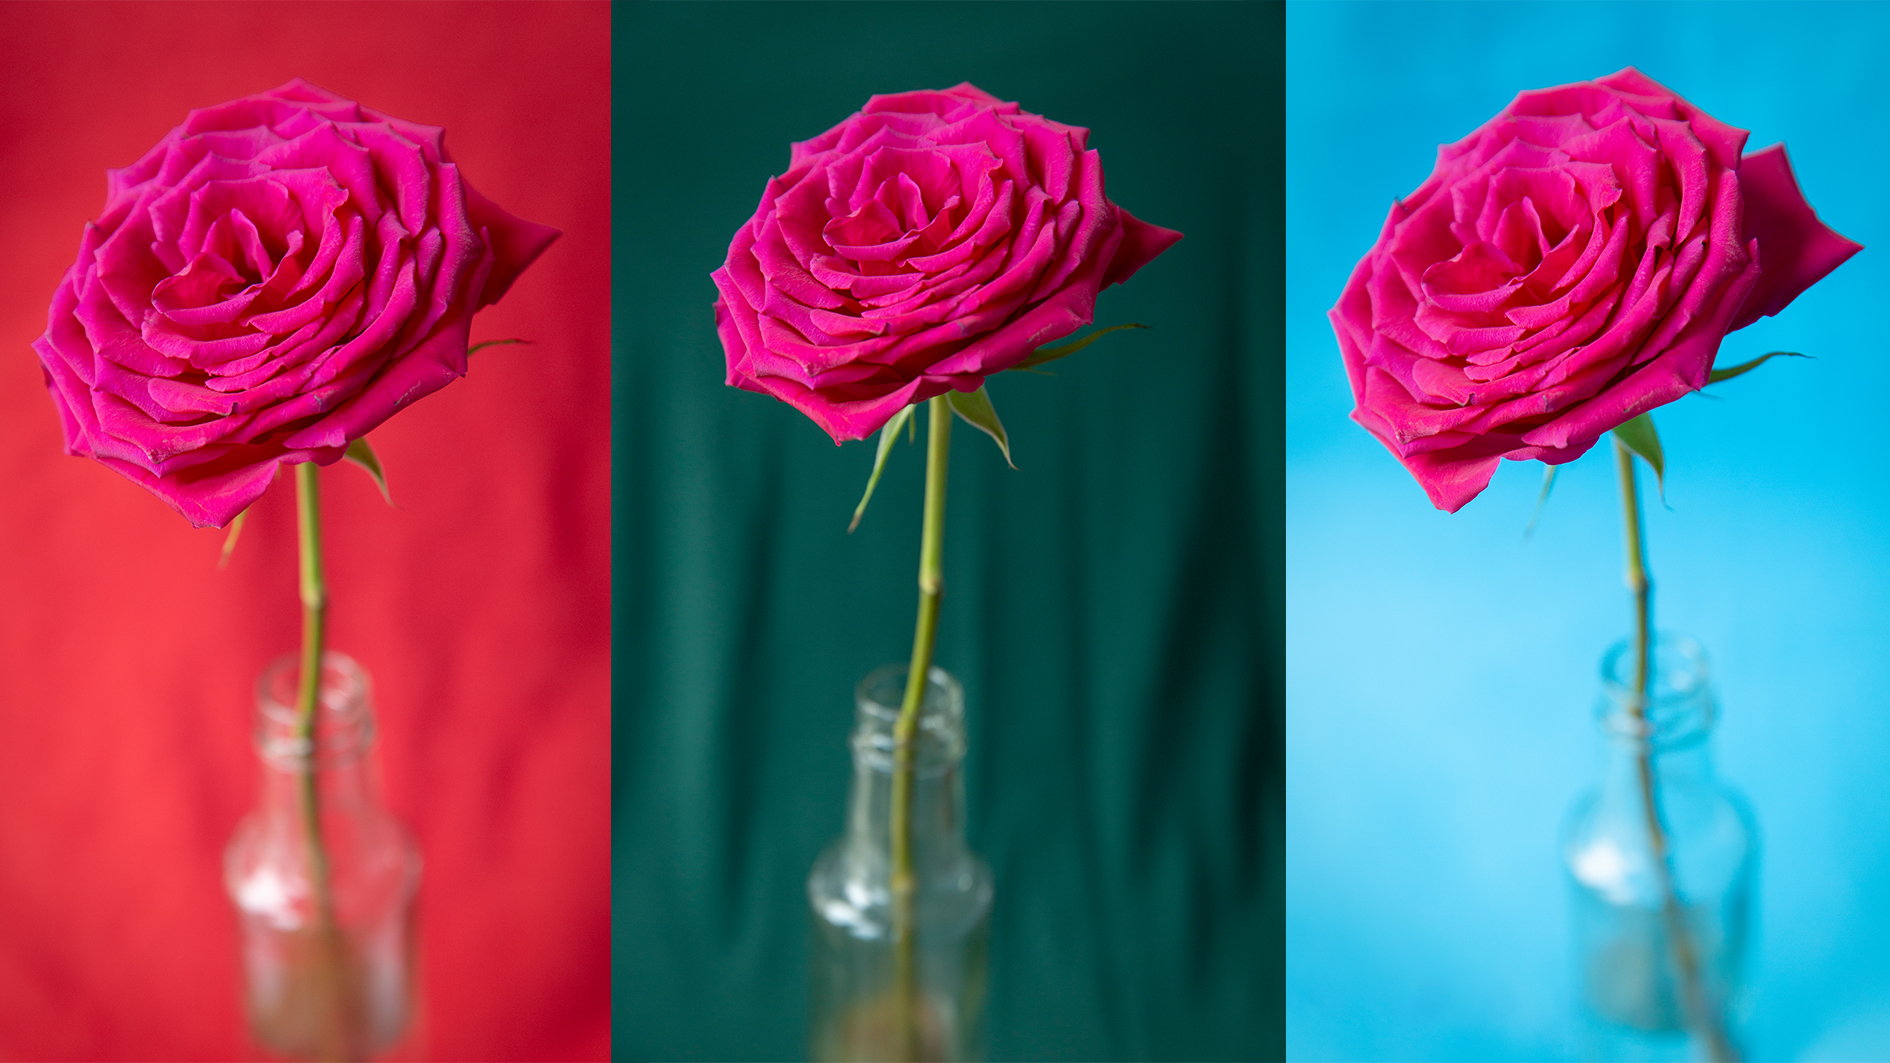
Even when the Brightness histogram shows a ‘perfect’ exposure, the red, green or blue channel can still be clipped – as our four shots on the right show.
If any colors are overly bright or clipped in either, you will need to reduce your exposure or, if possible, shoot when the light is softer – or in the shade and out of direct sunlight – to compensate and retain detail in that color.
The best camera deals, reviews, product advice, and unmissable photography news, direct to your inbox!
01 Subject to shoot
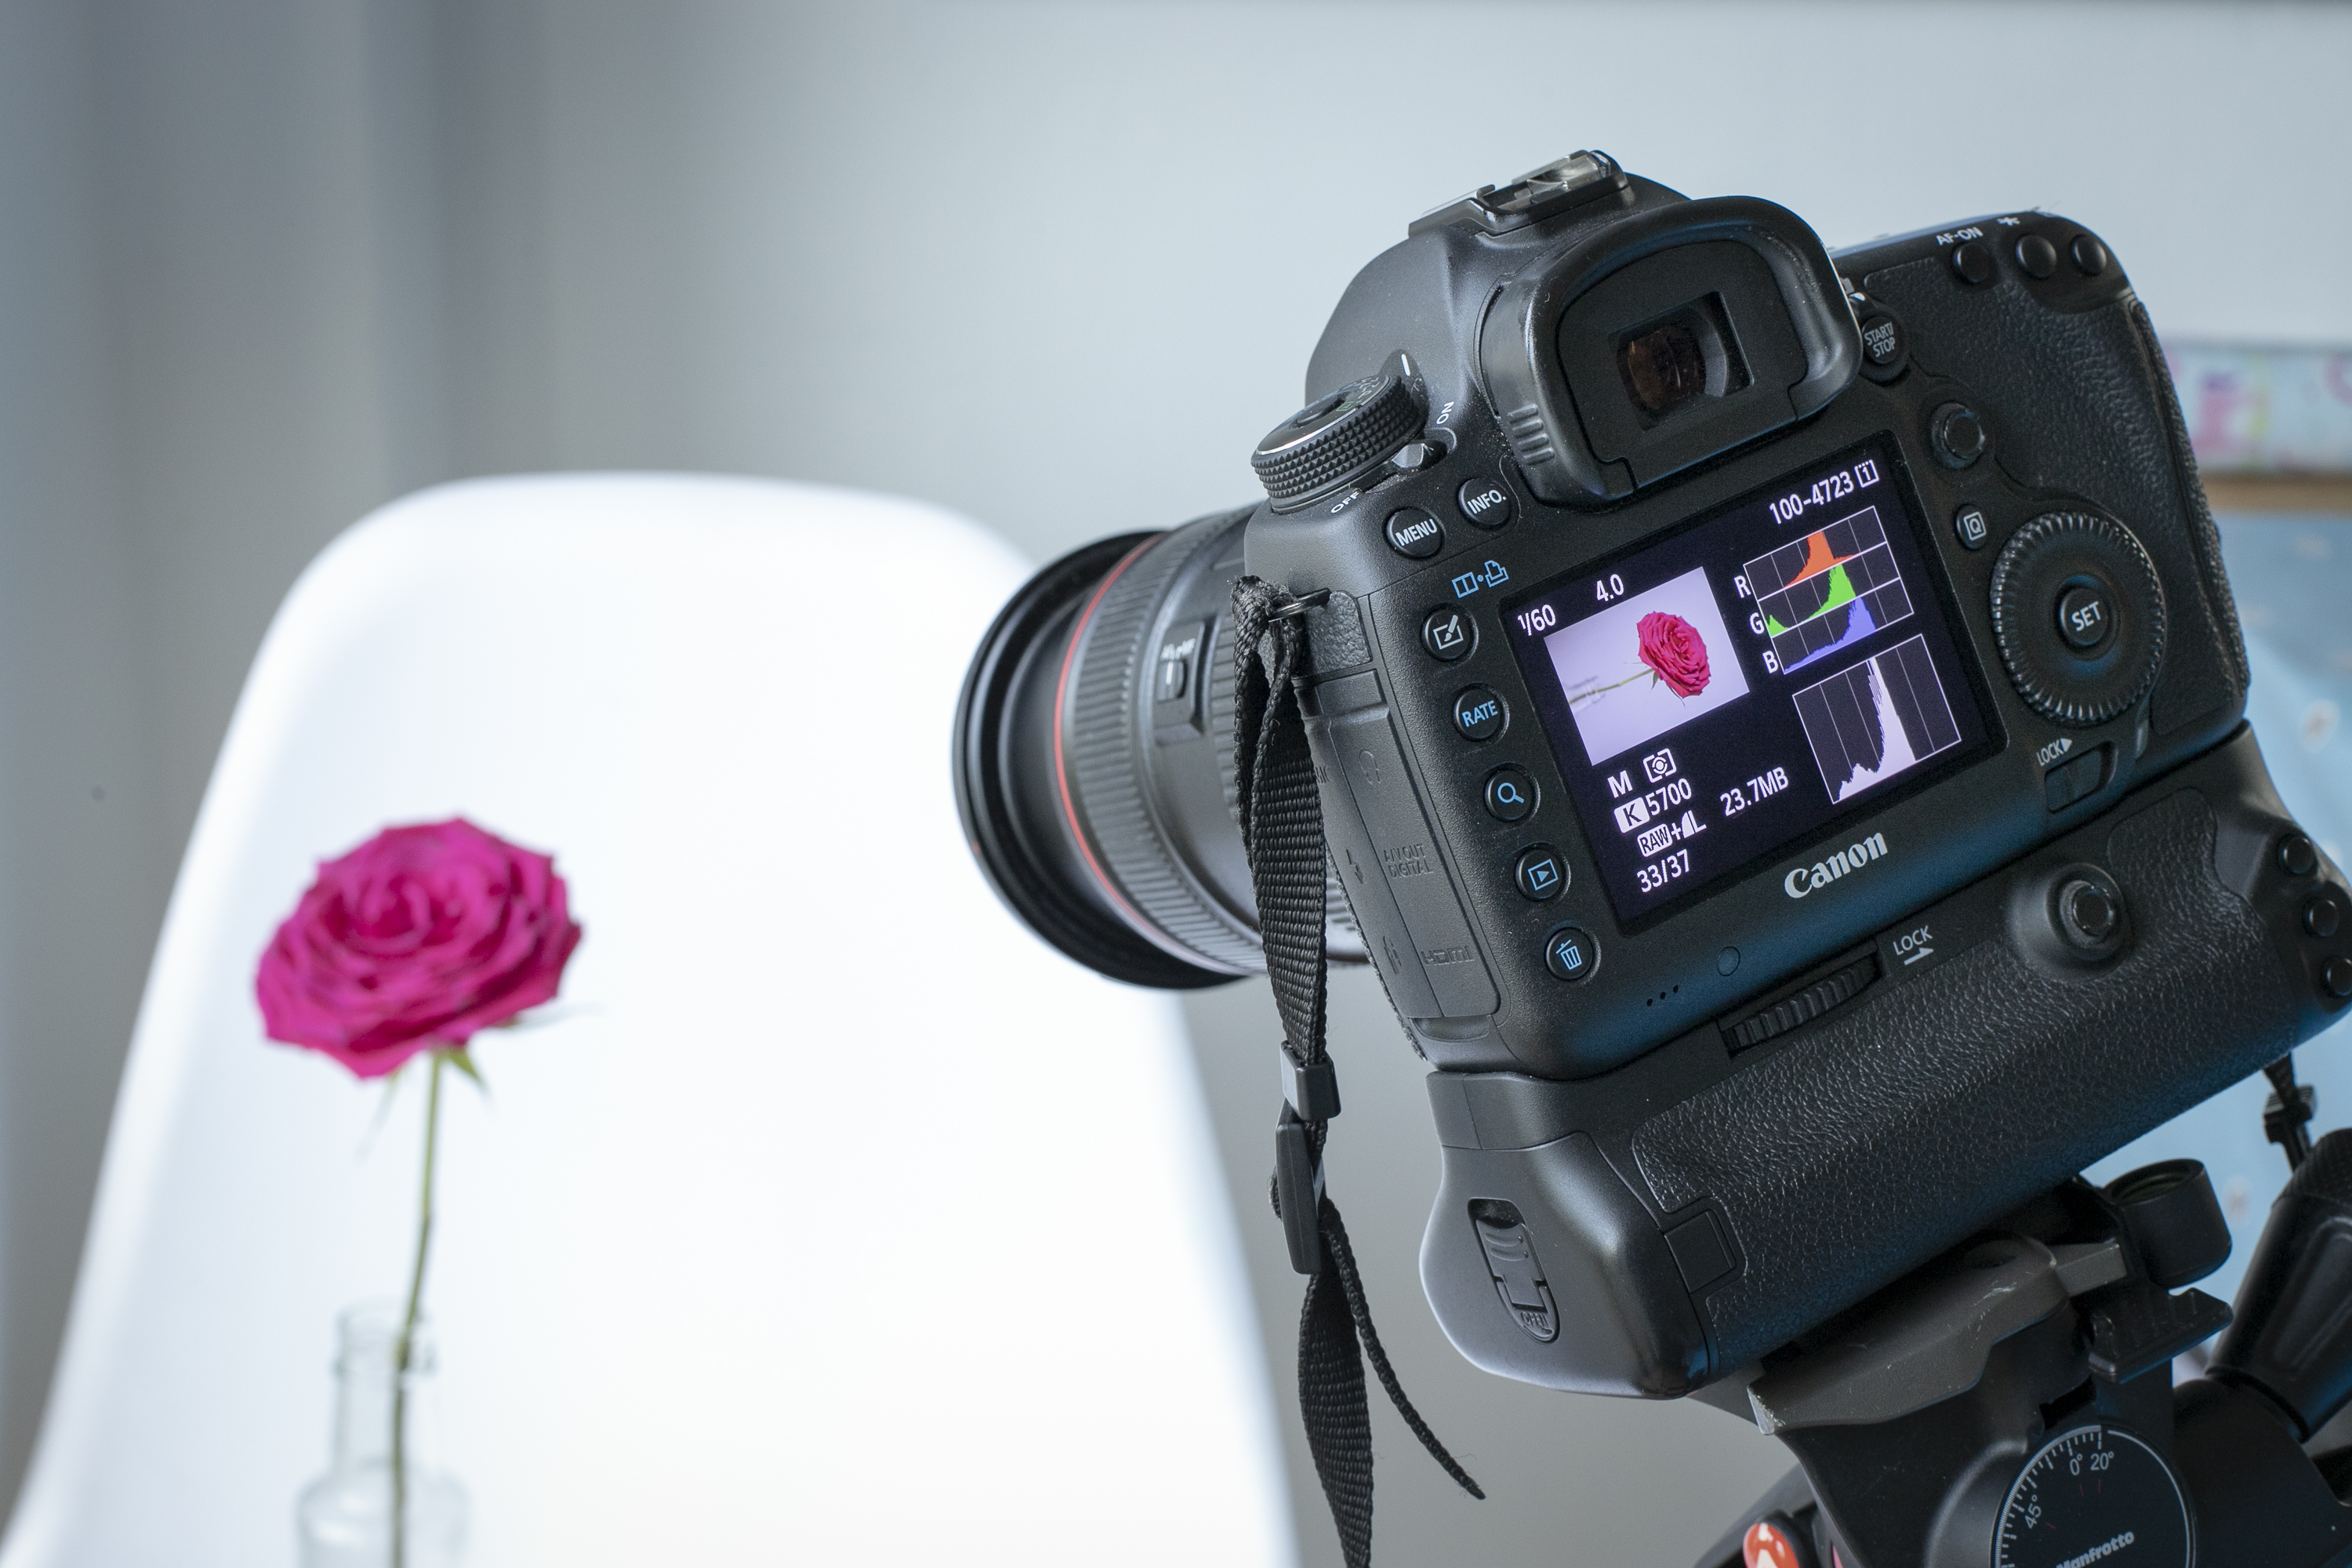
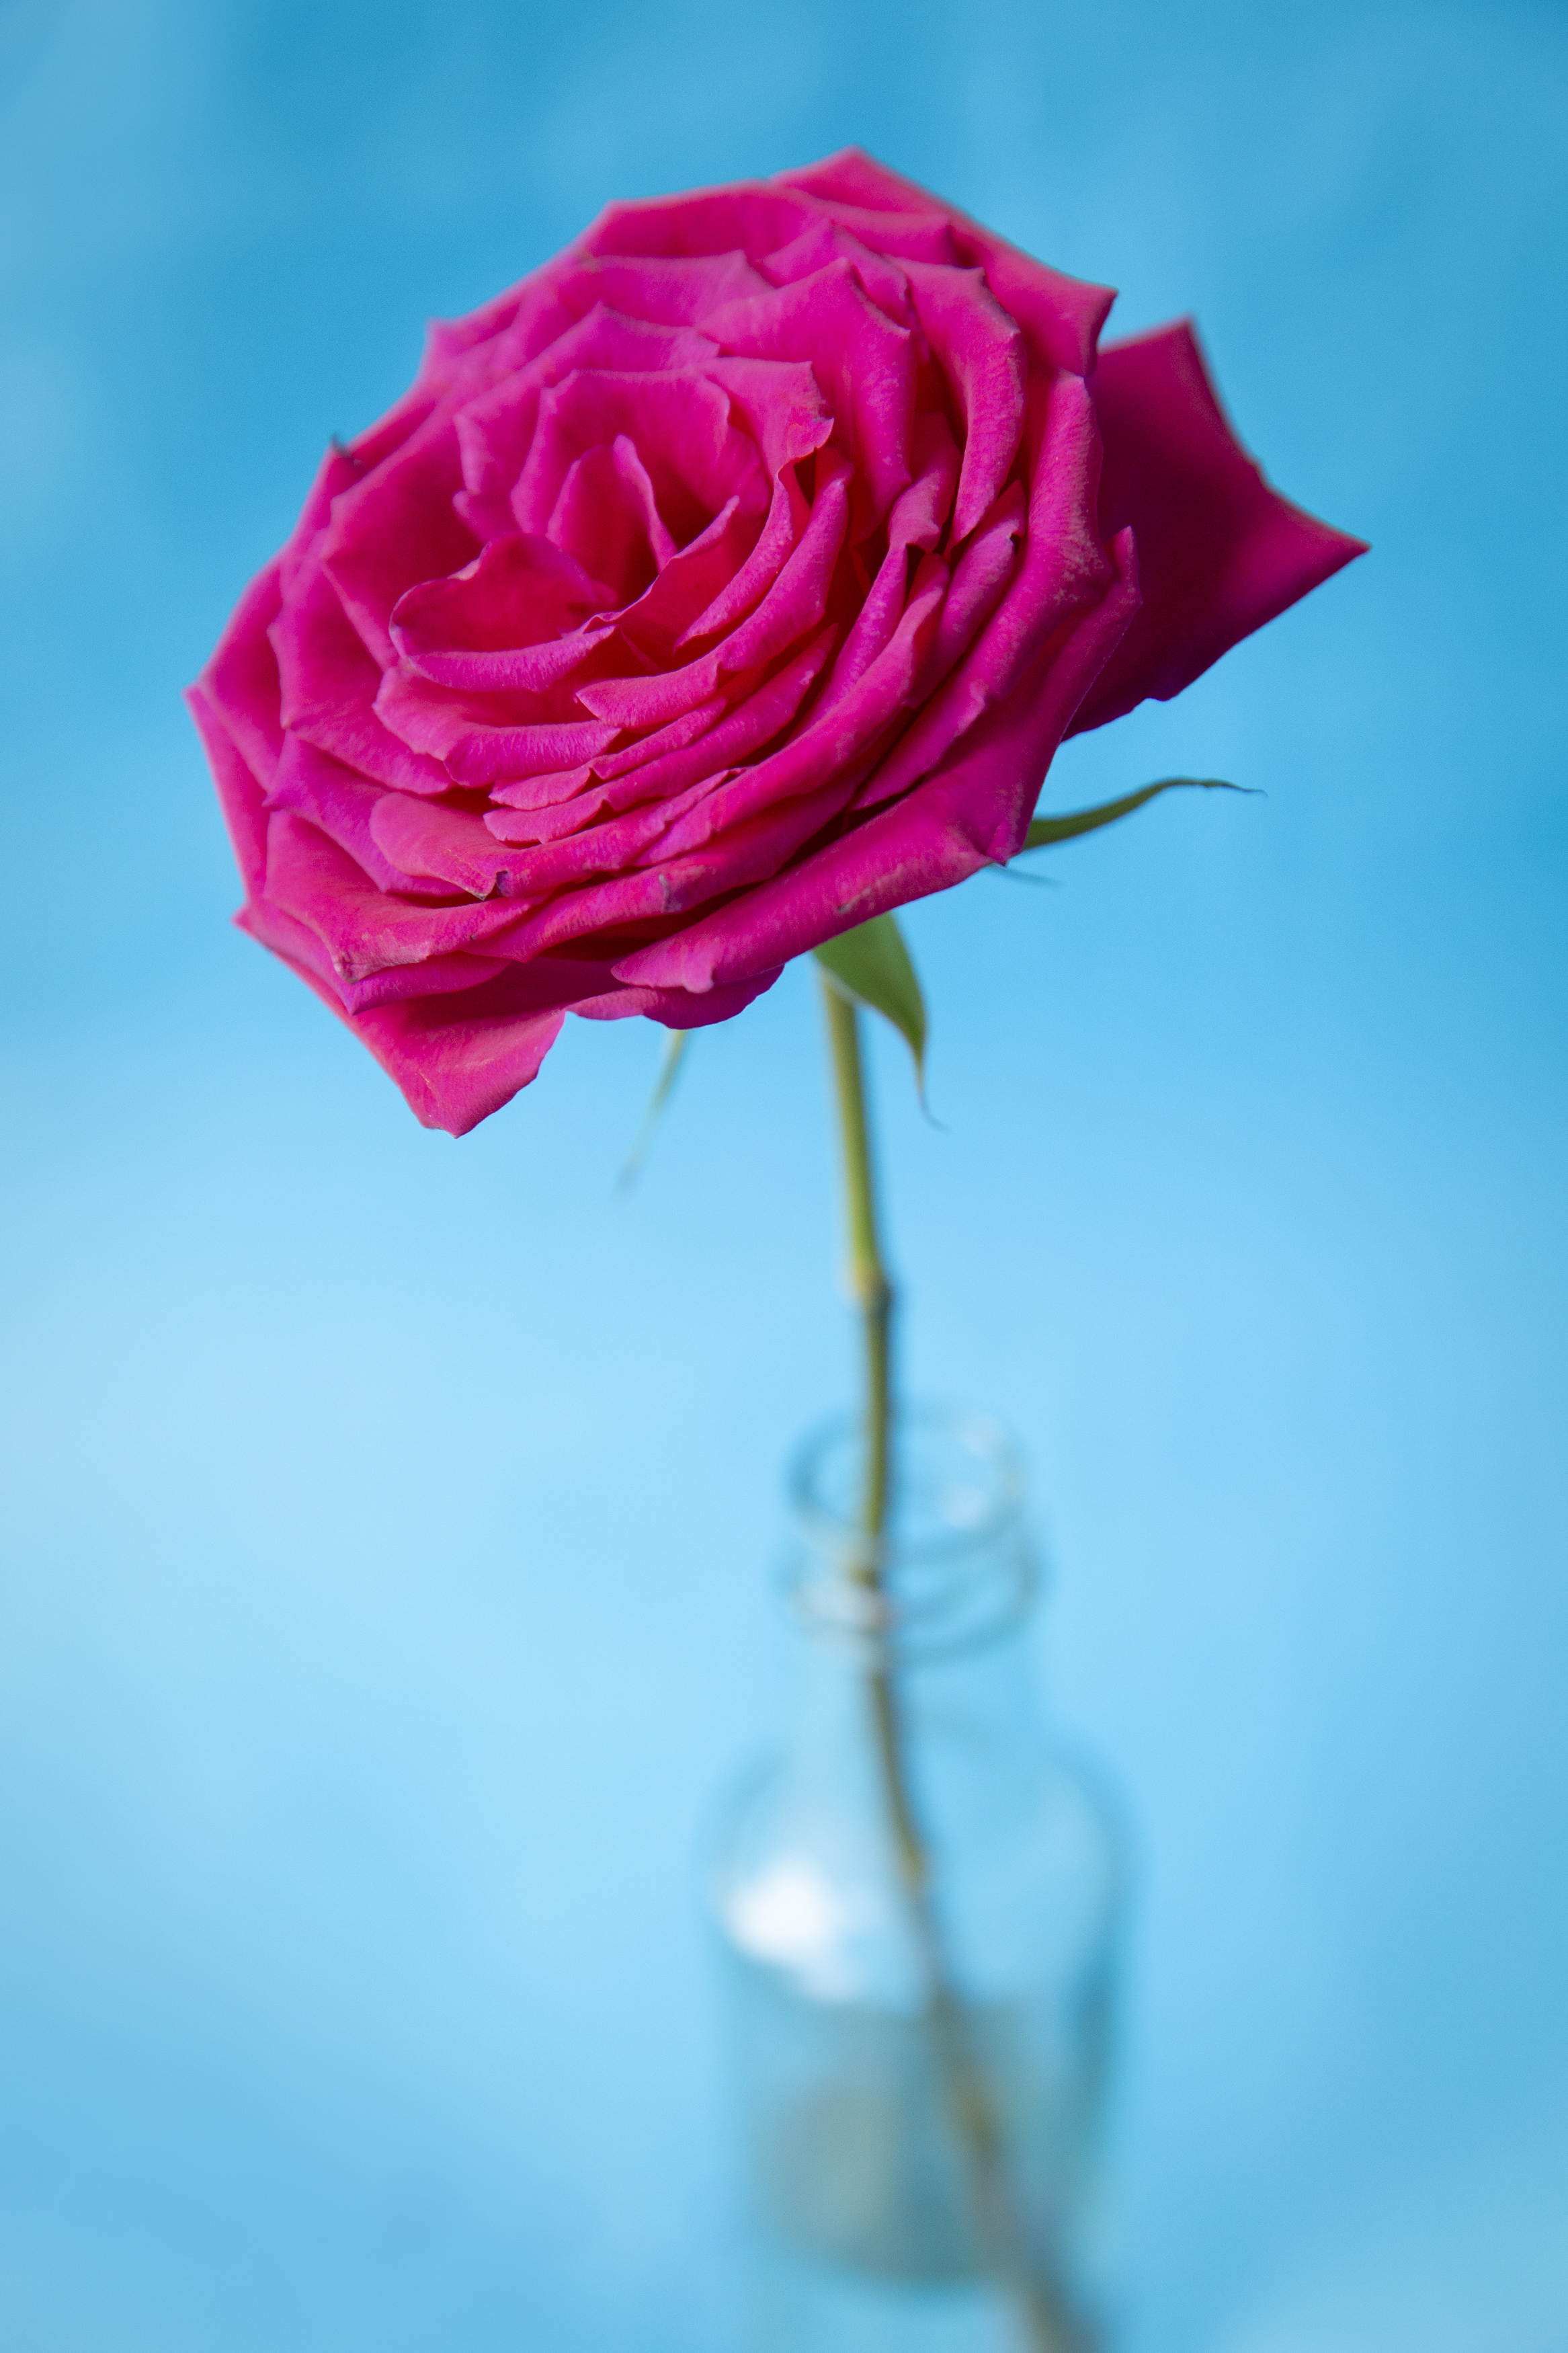
We’ve chosen a vibrant burgundy rose, which will challenge our camera's sensor. We positioned the rose in a vase near a window for soft, indirect light, and used white, red, blue and green backdrops.
2. Camera and lens setup
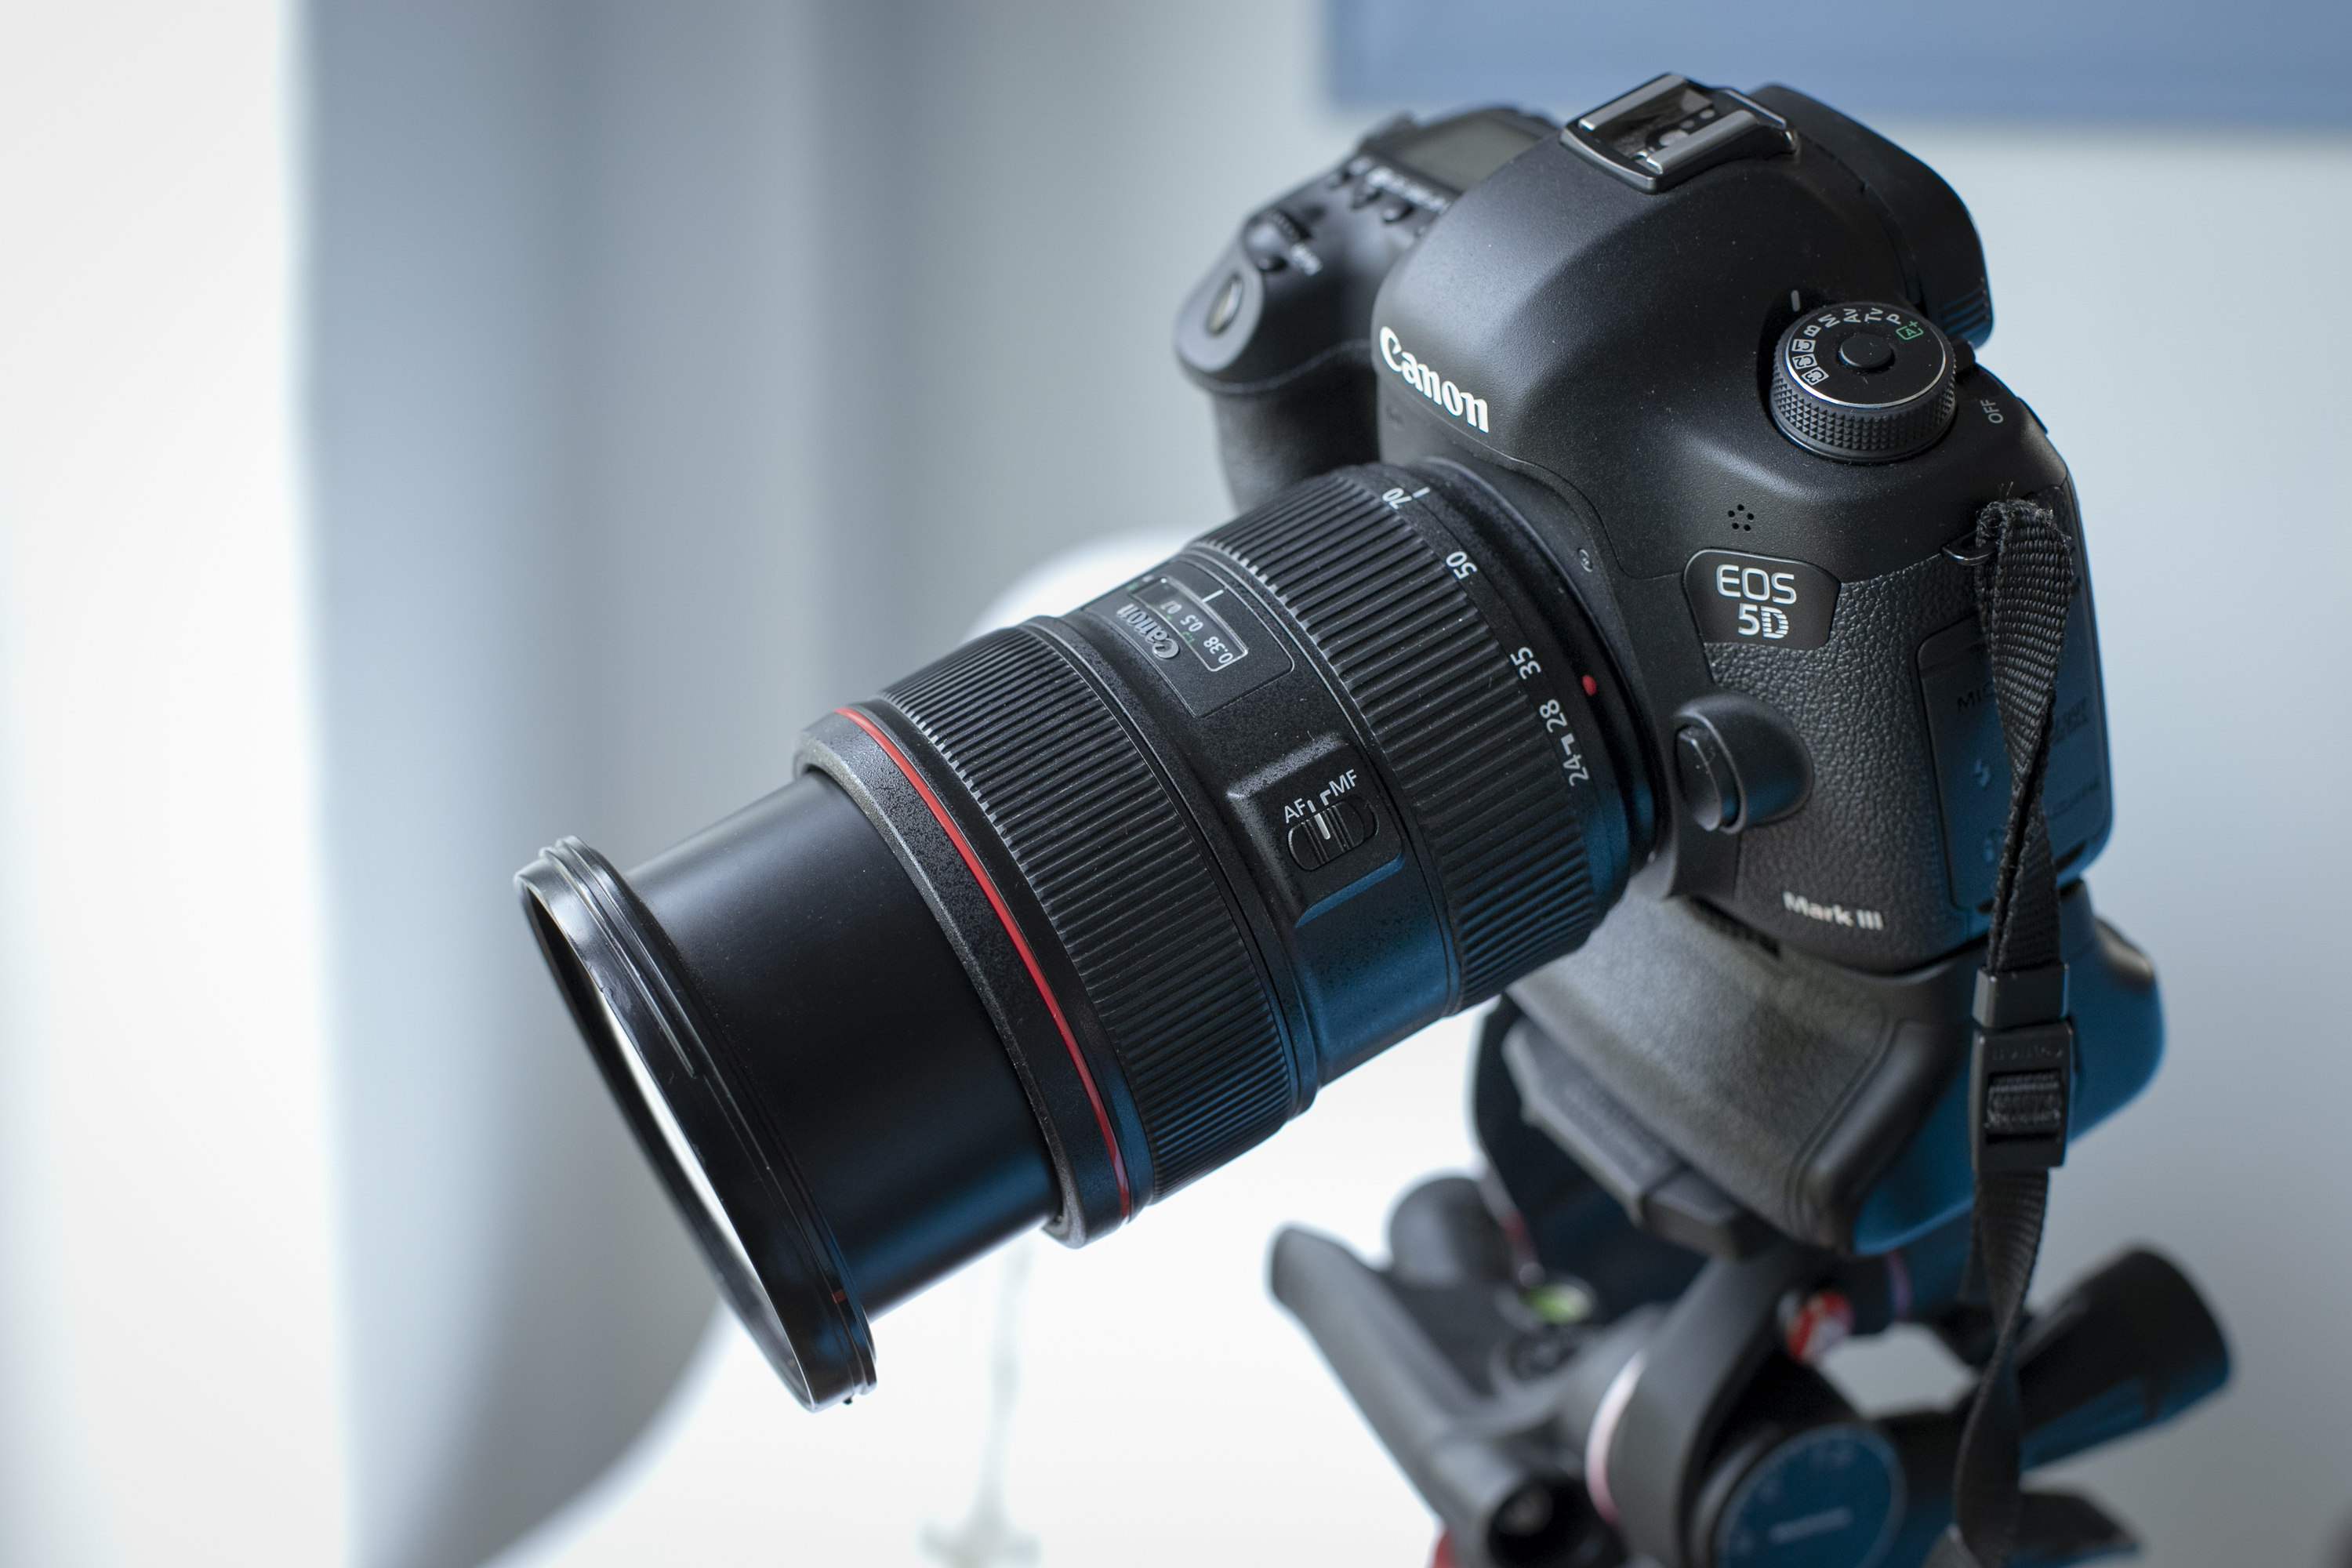
We’re using a full-frame Canon EOS 5D Mark III camera, and our flexible Canon EF 24-70mm f/2.8L zoom lens, so we can capture close-up compositions of the rose by shooting at a focal length of 70mm.
3. Correct exposure
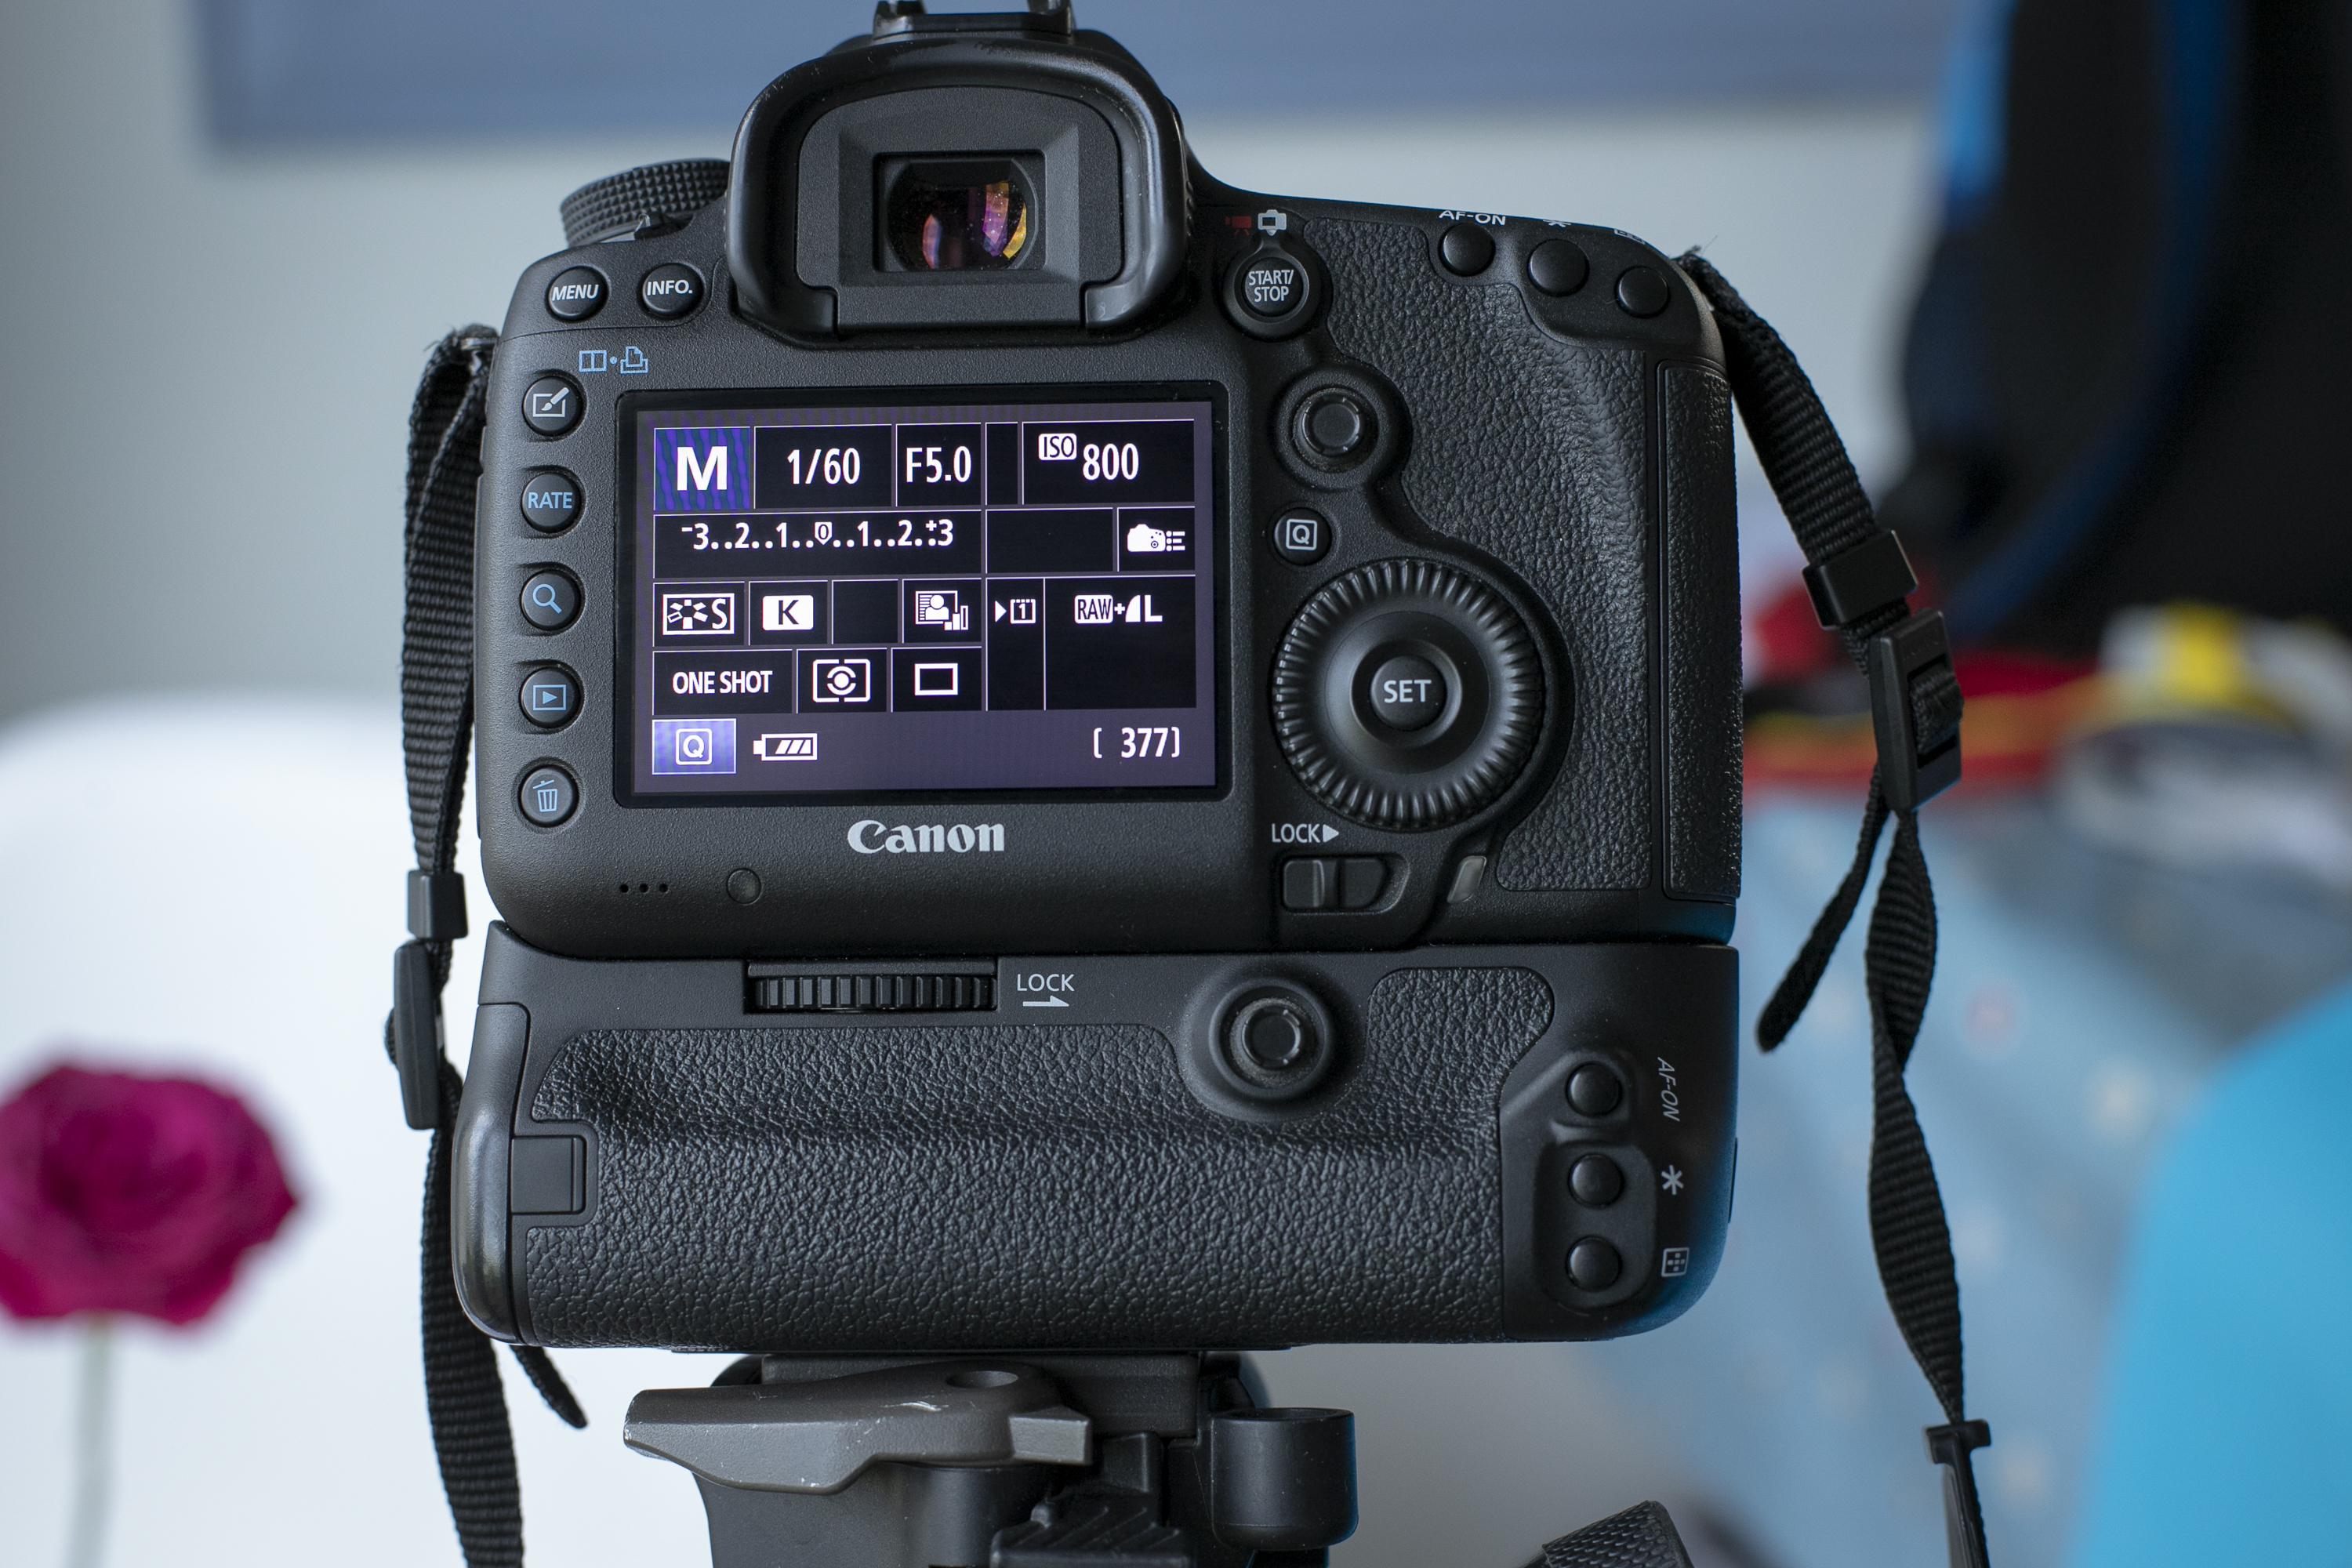
We shot in manual mode to control our aperture and shutter speed for a good exposure – which is the key to getting accurate colors. We shot on a tripod at f/5, 1/60 sec and ISO800 for each of the different red, blue and green backdrops.
4. RGB histogram view
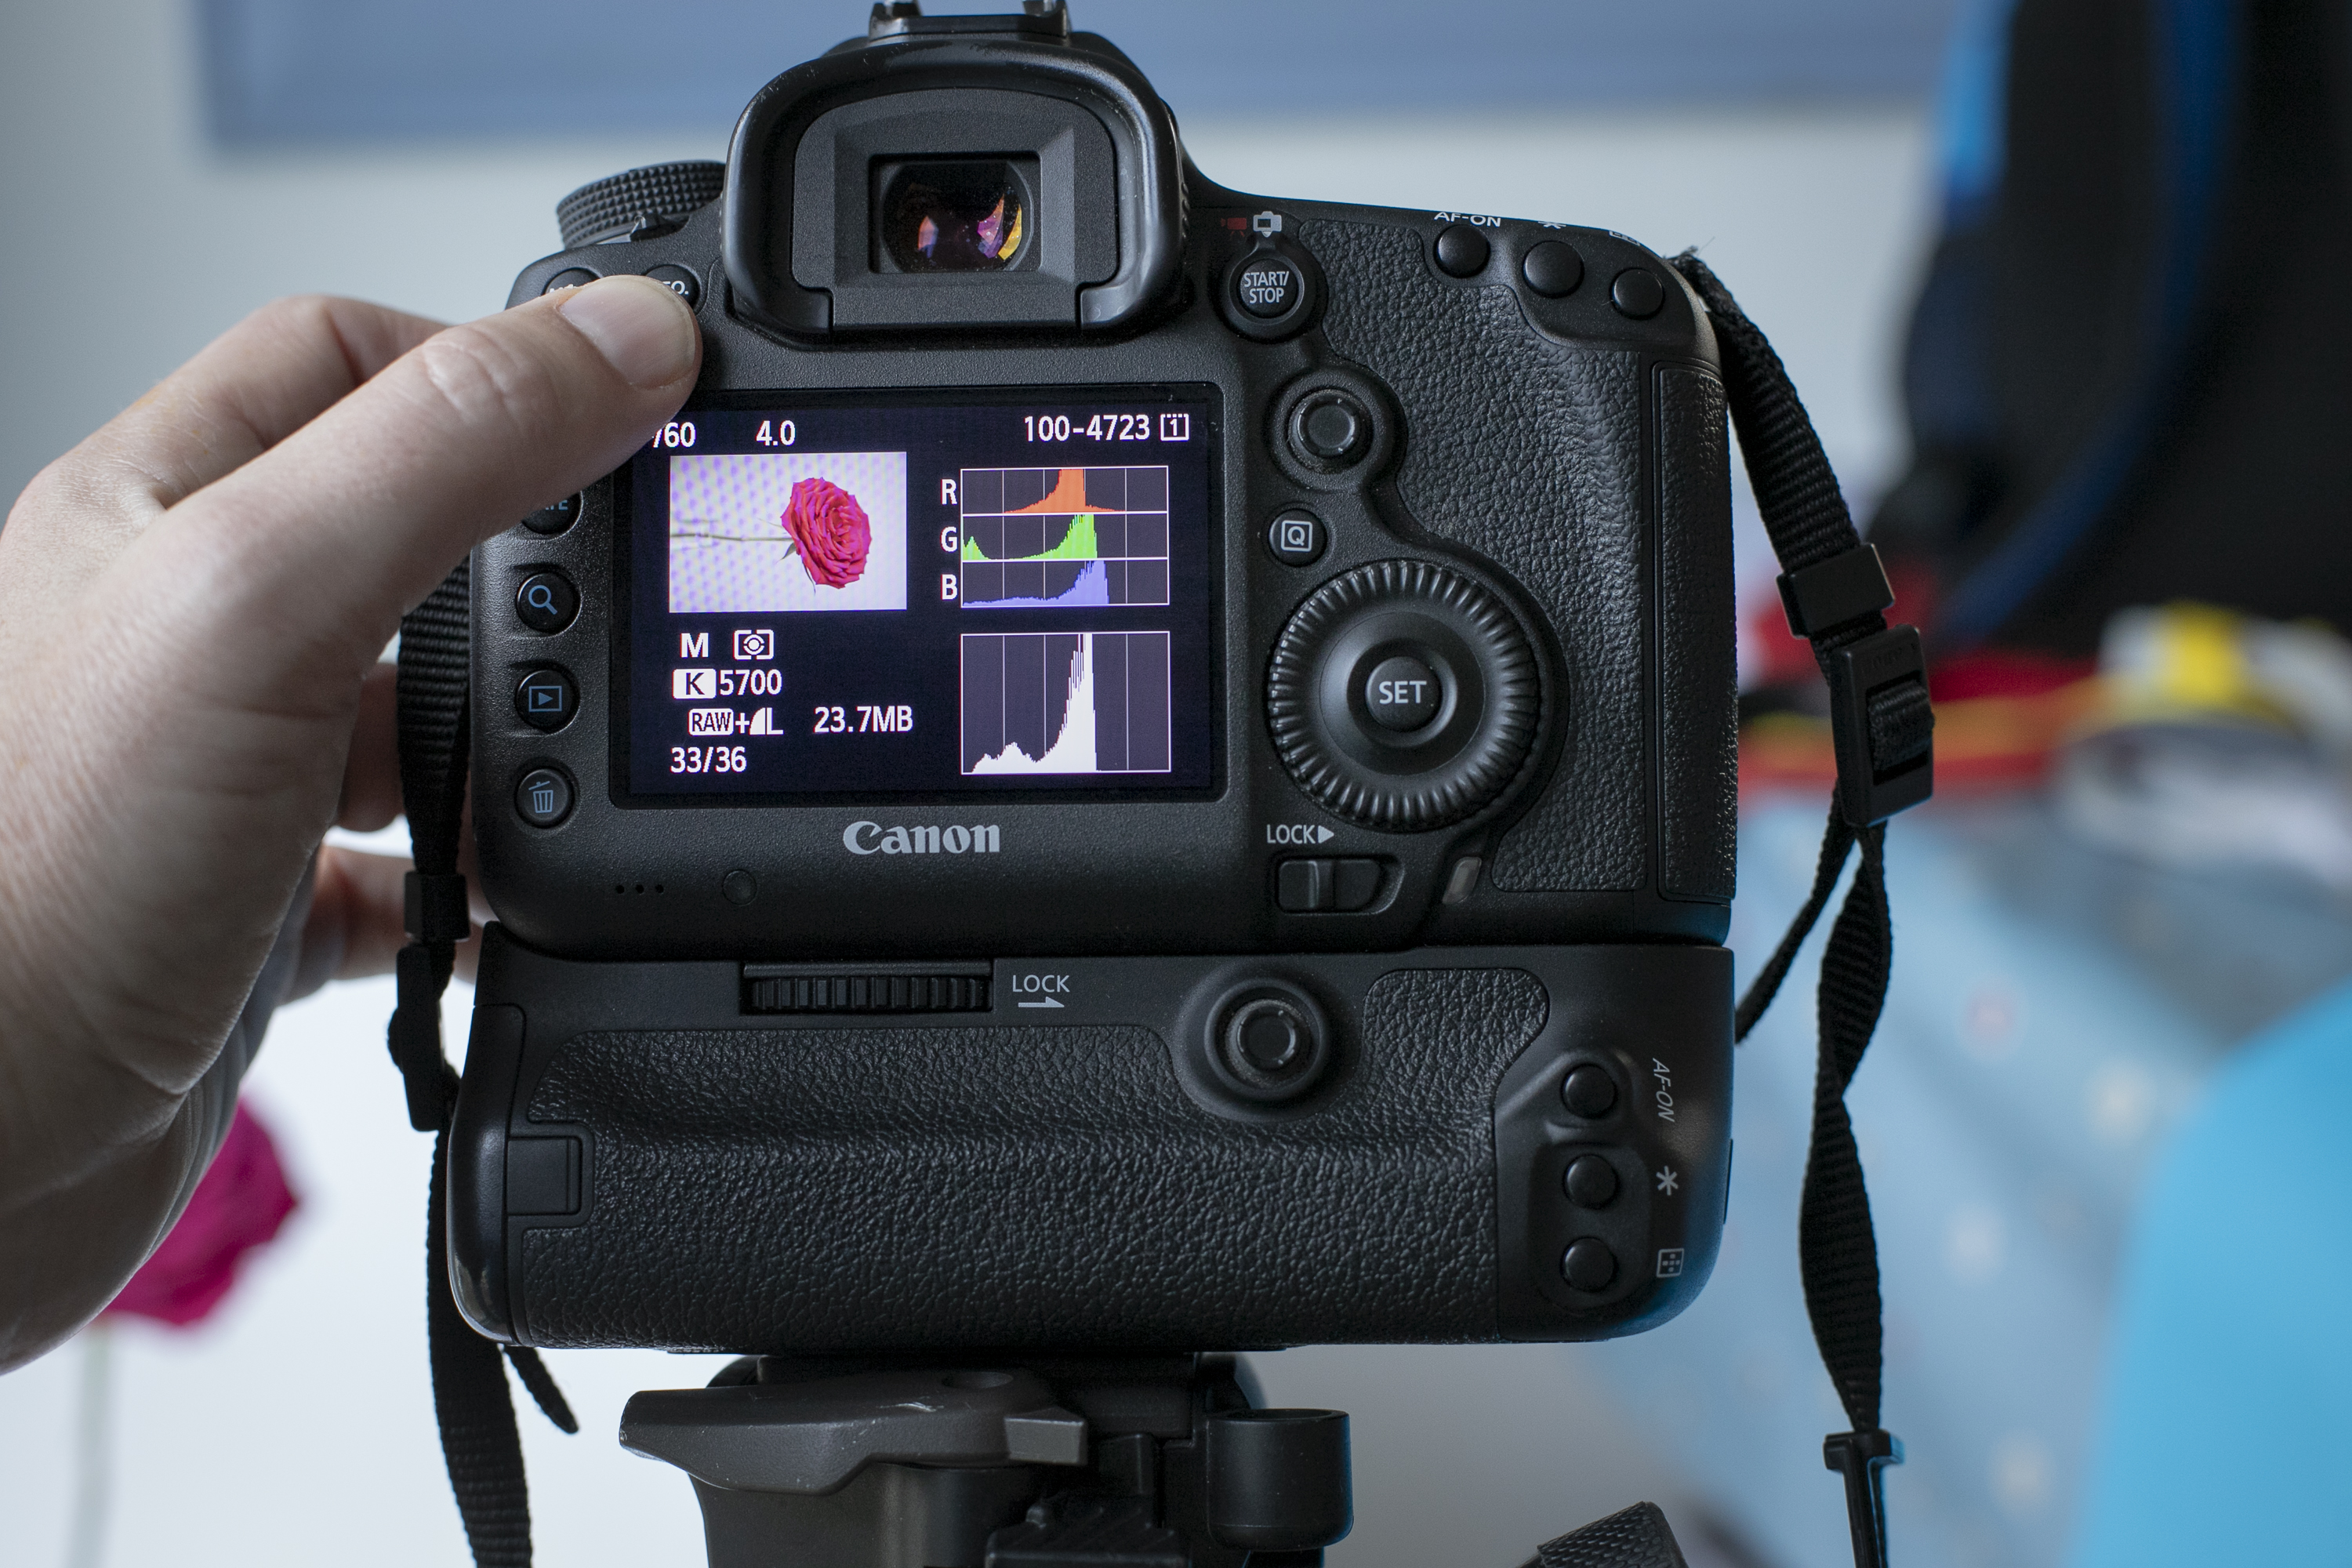
To view the Brightness and RGB histograms, press the playback button on your camera to review your image on the LCD, then press the info or display button until you cycle through to the RGB histogram view.
5. White backdrop
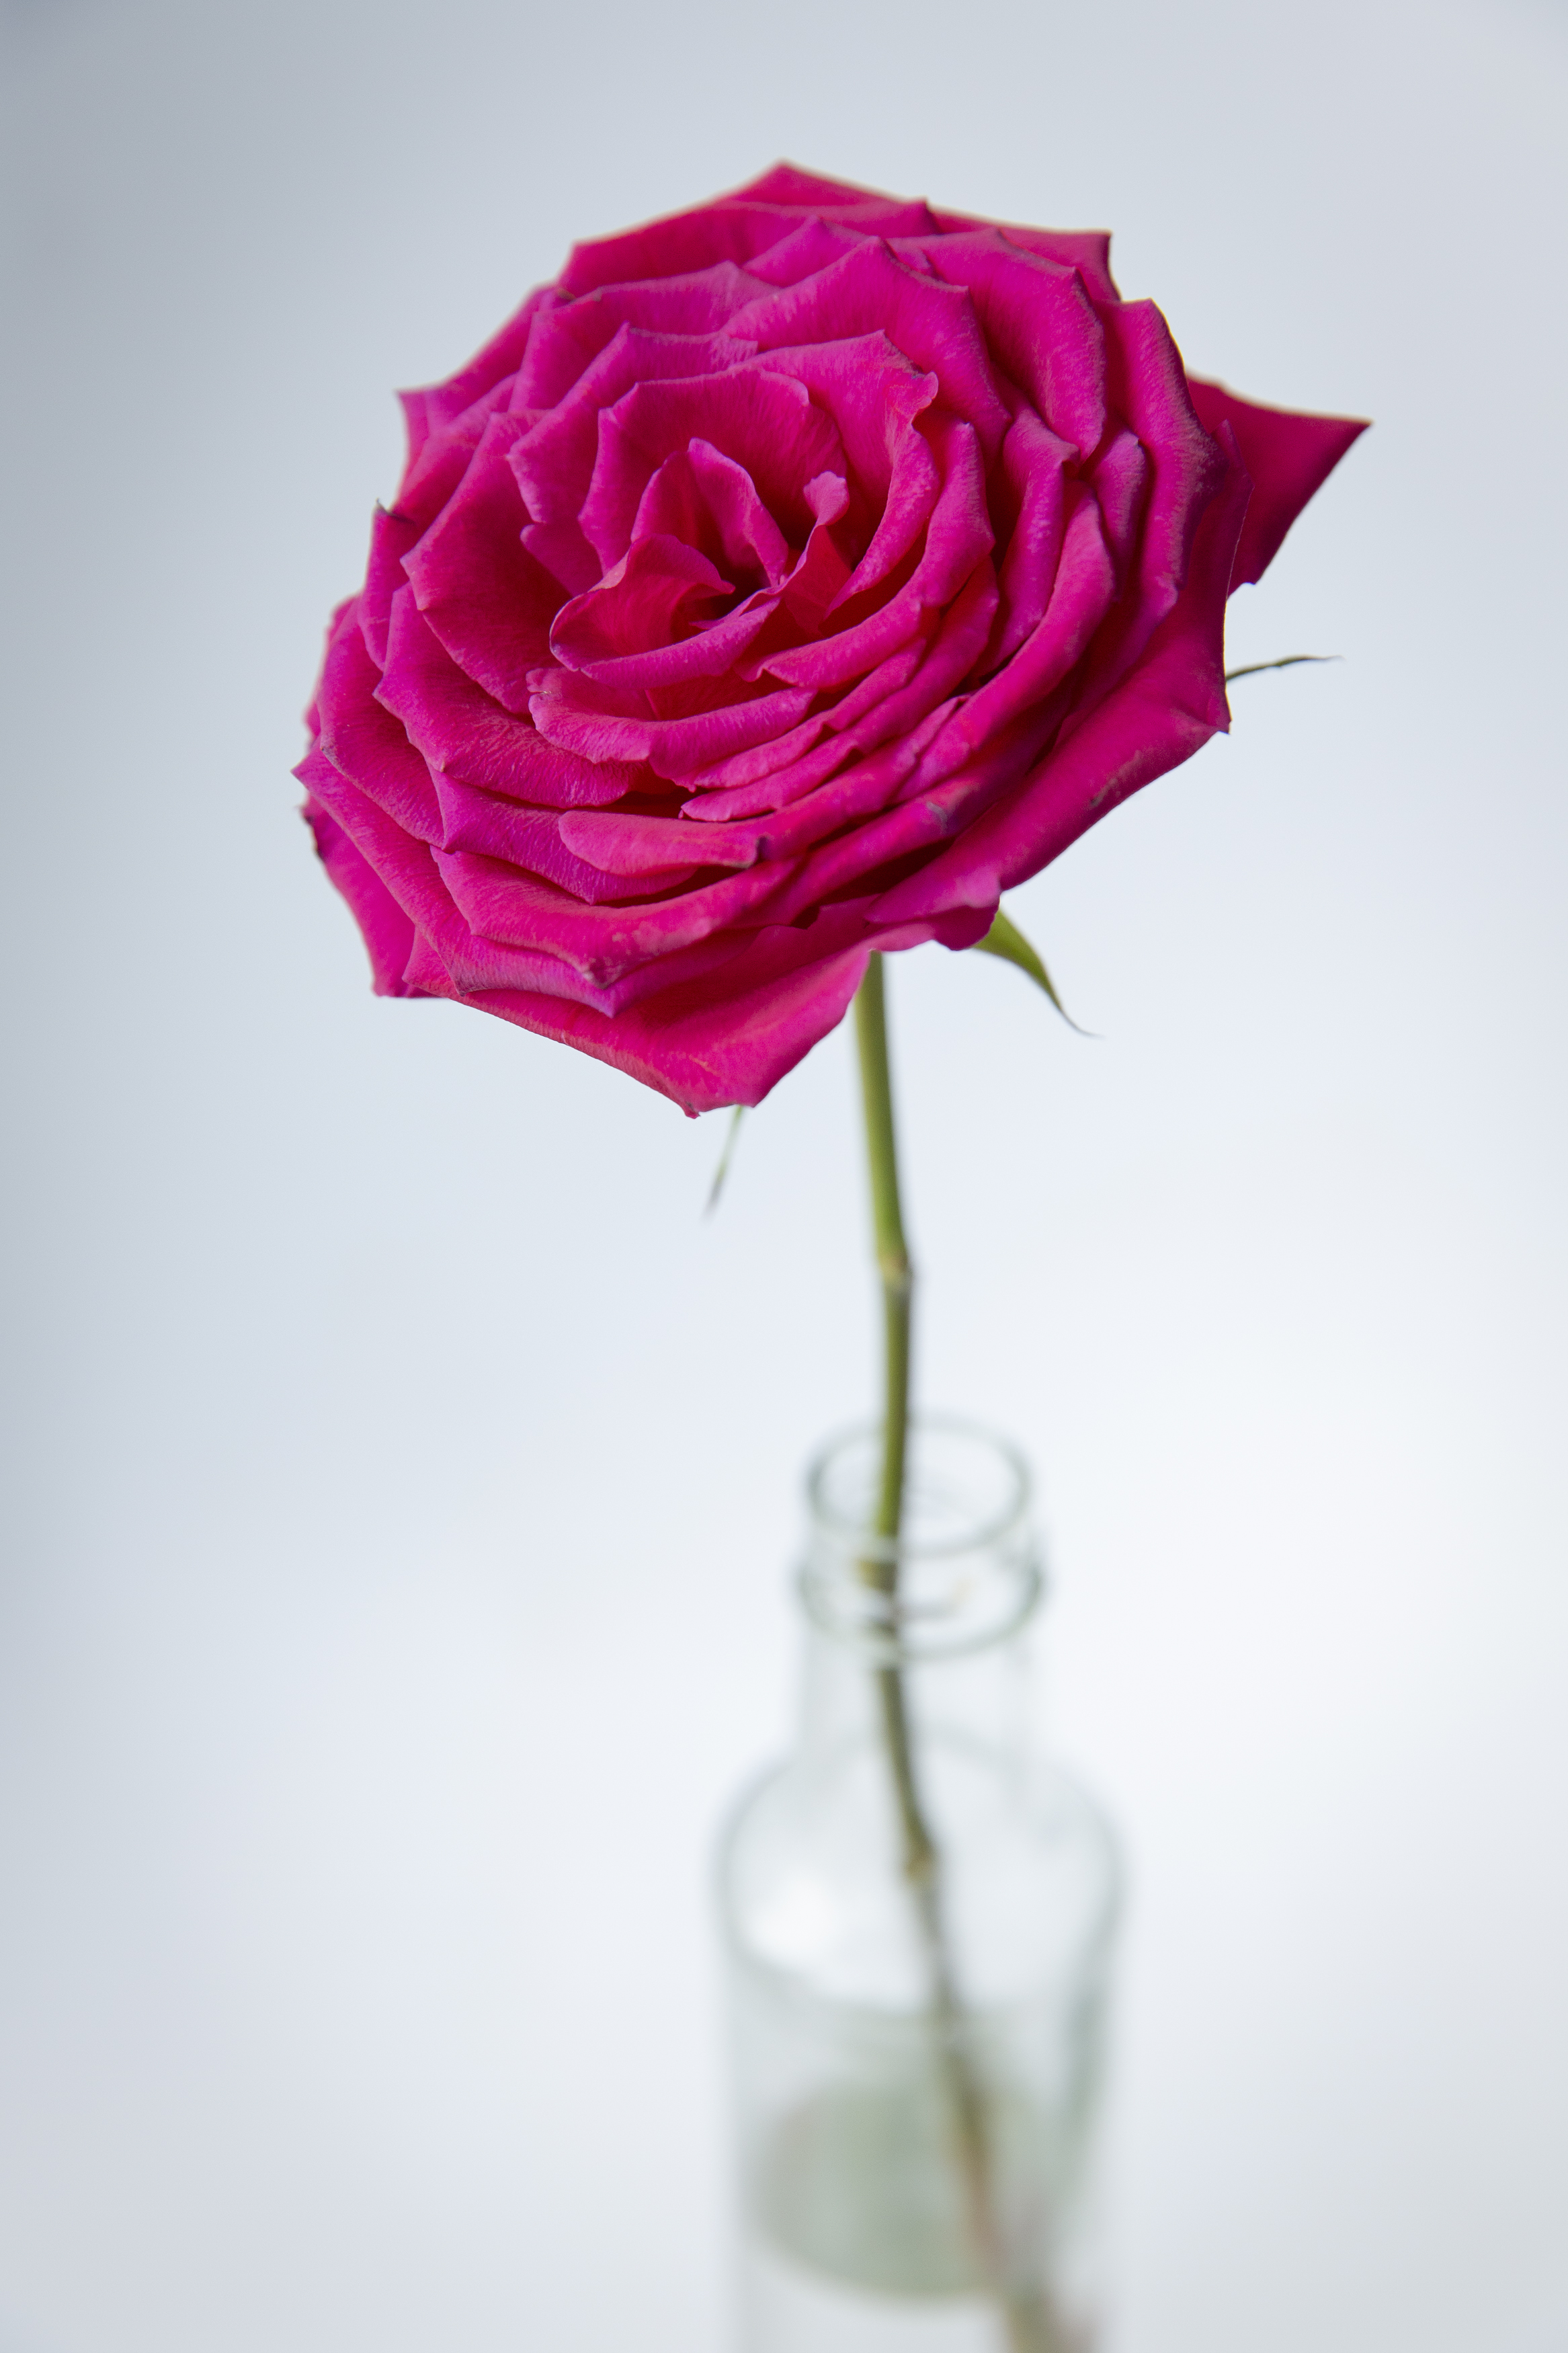
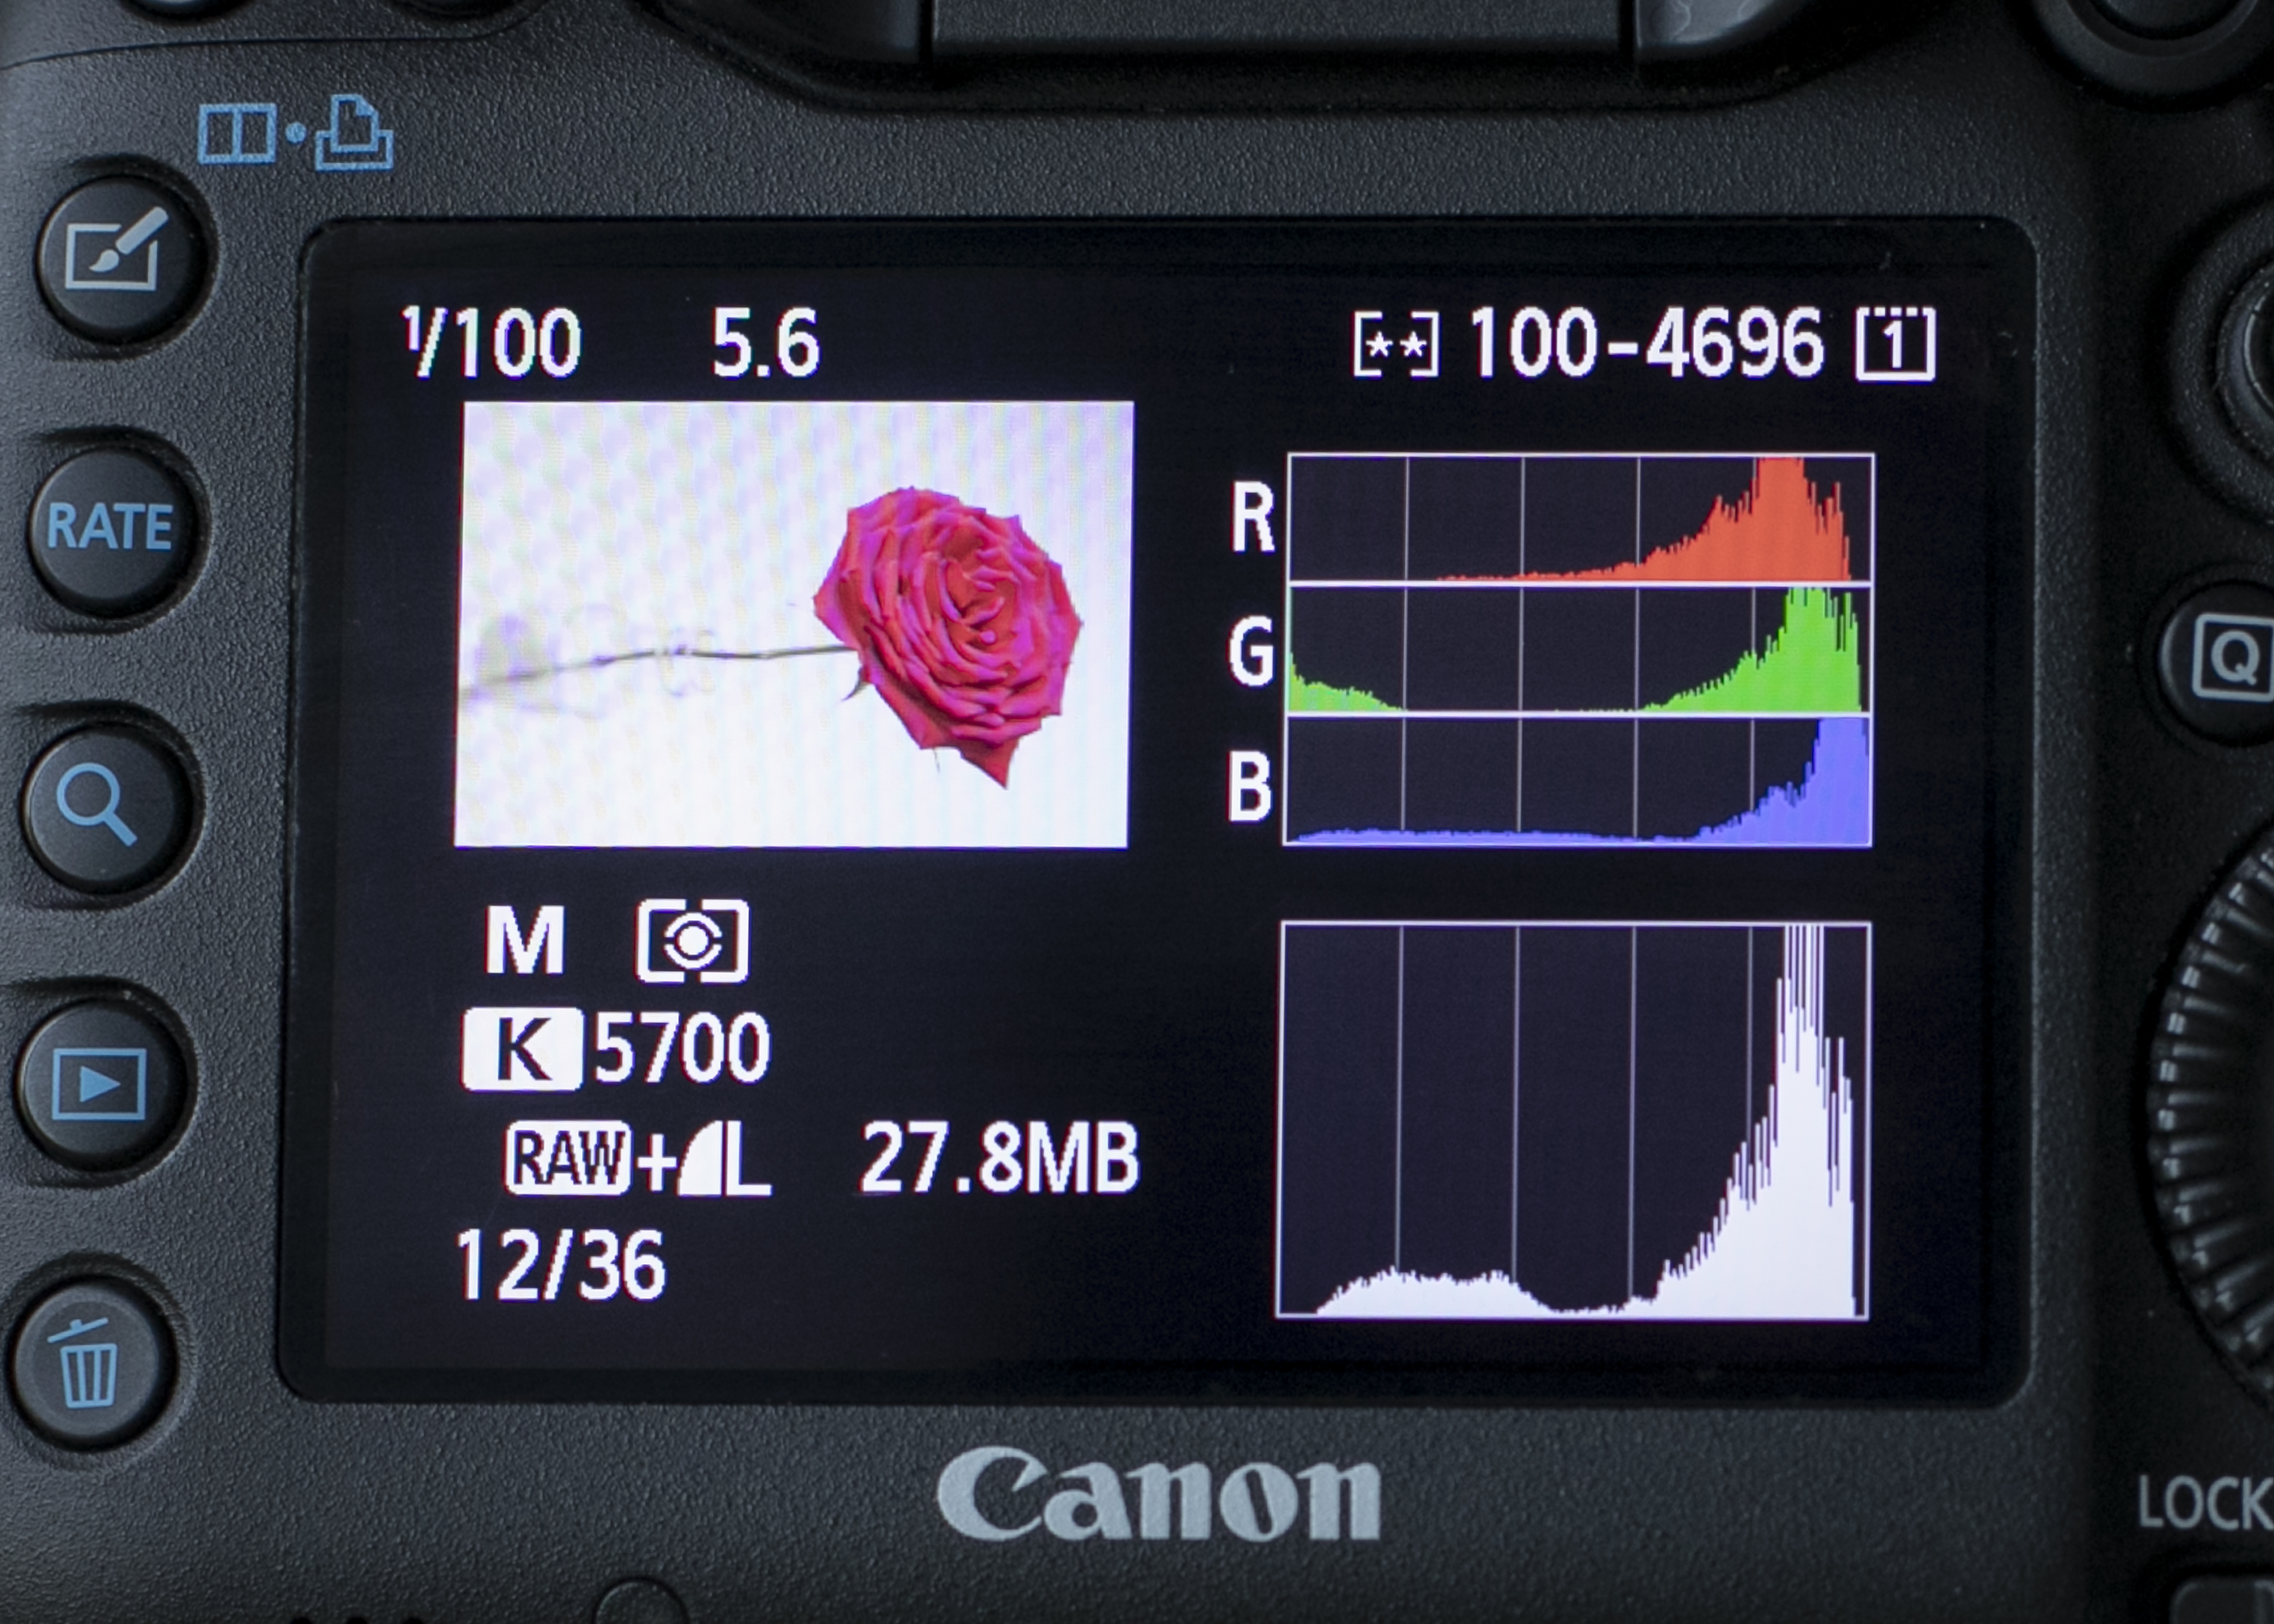
With a correct exposure, the histogram shows that the blue channel is clipped, even though the Brightness histogram shows a good exposure.
6. Red backdrop
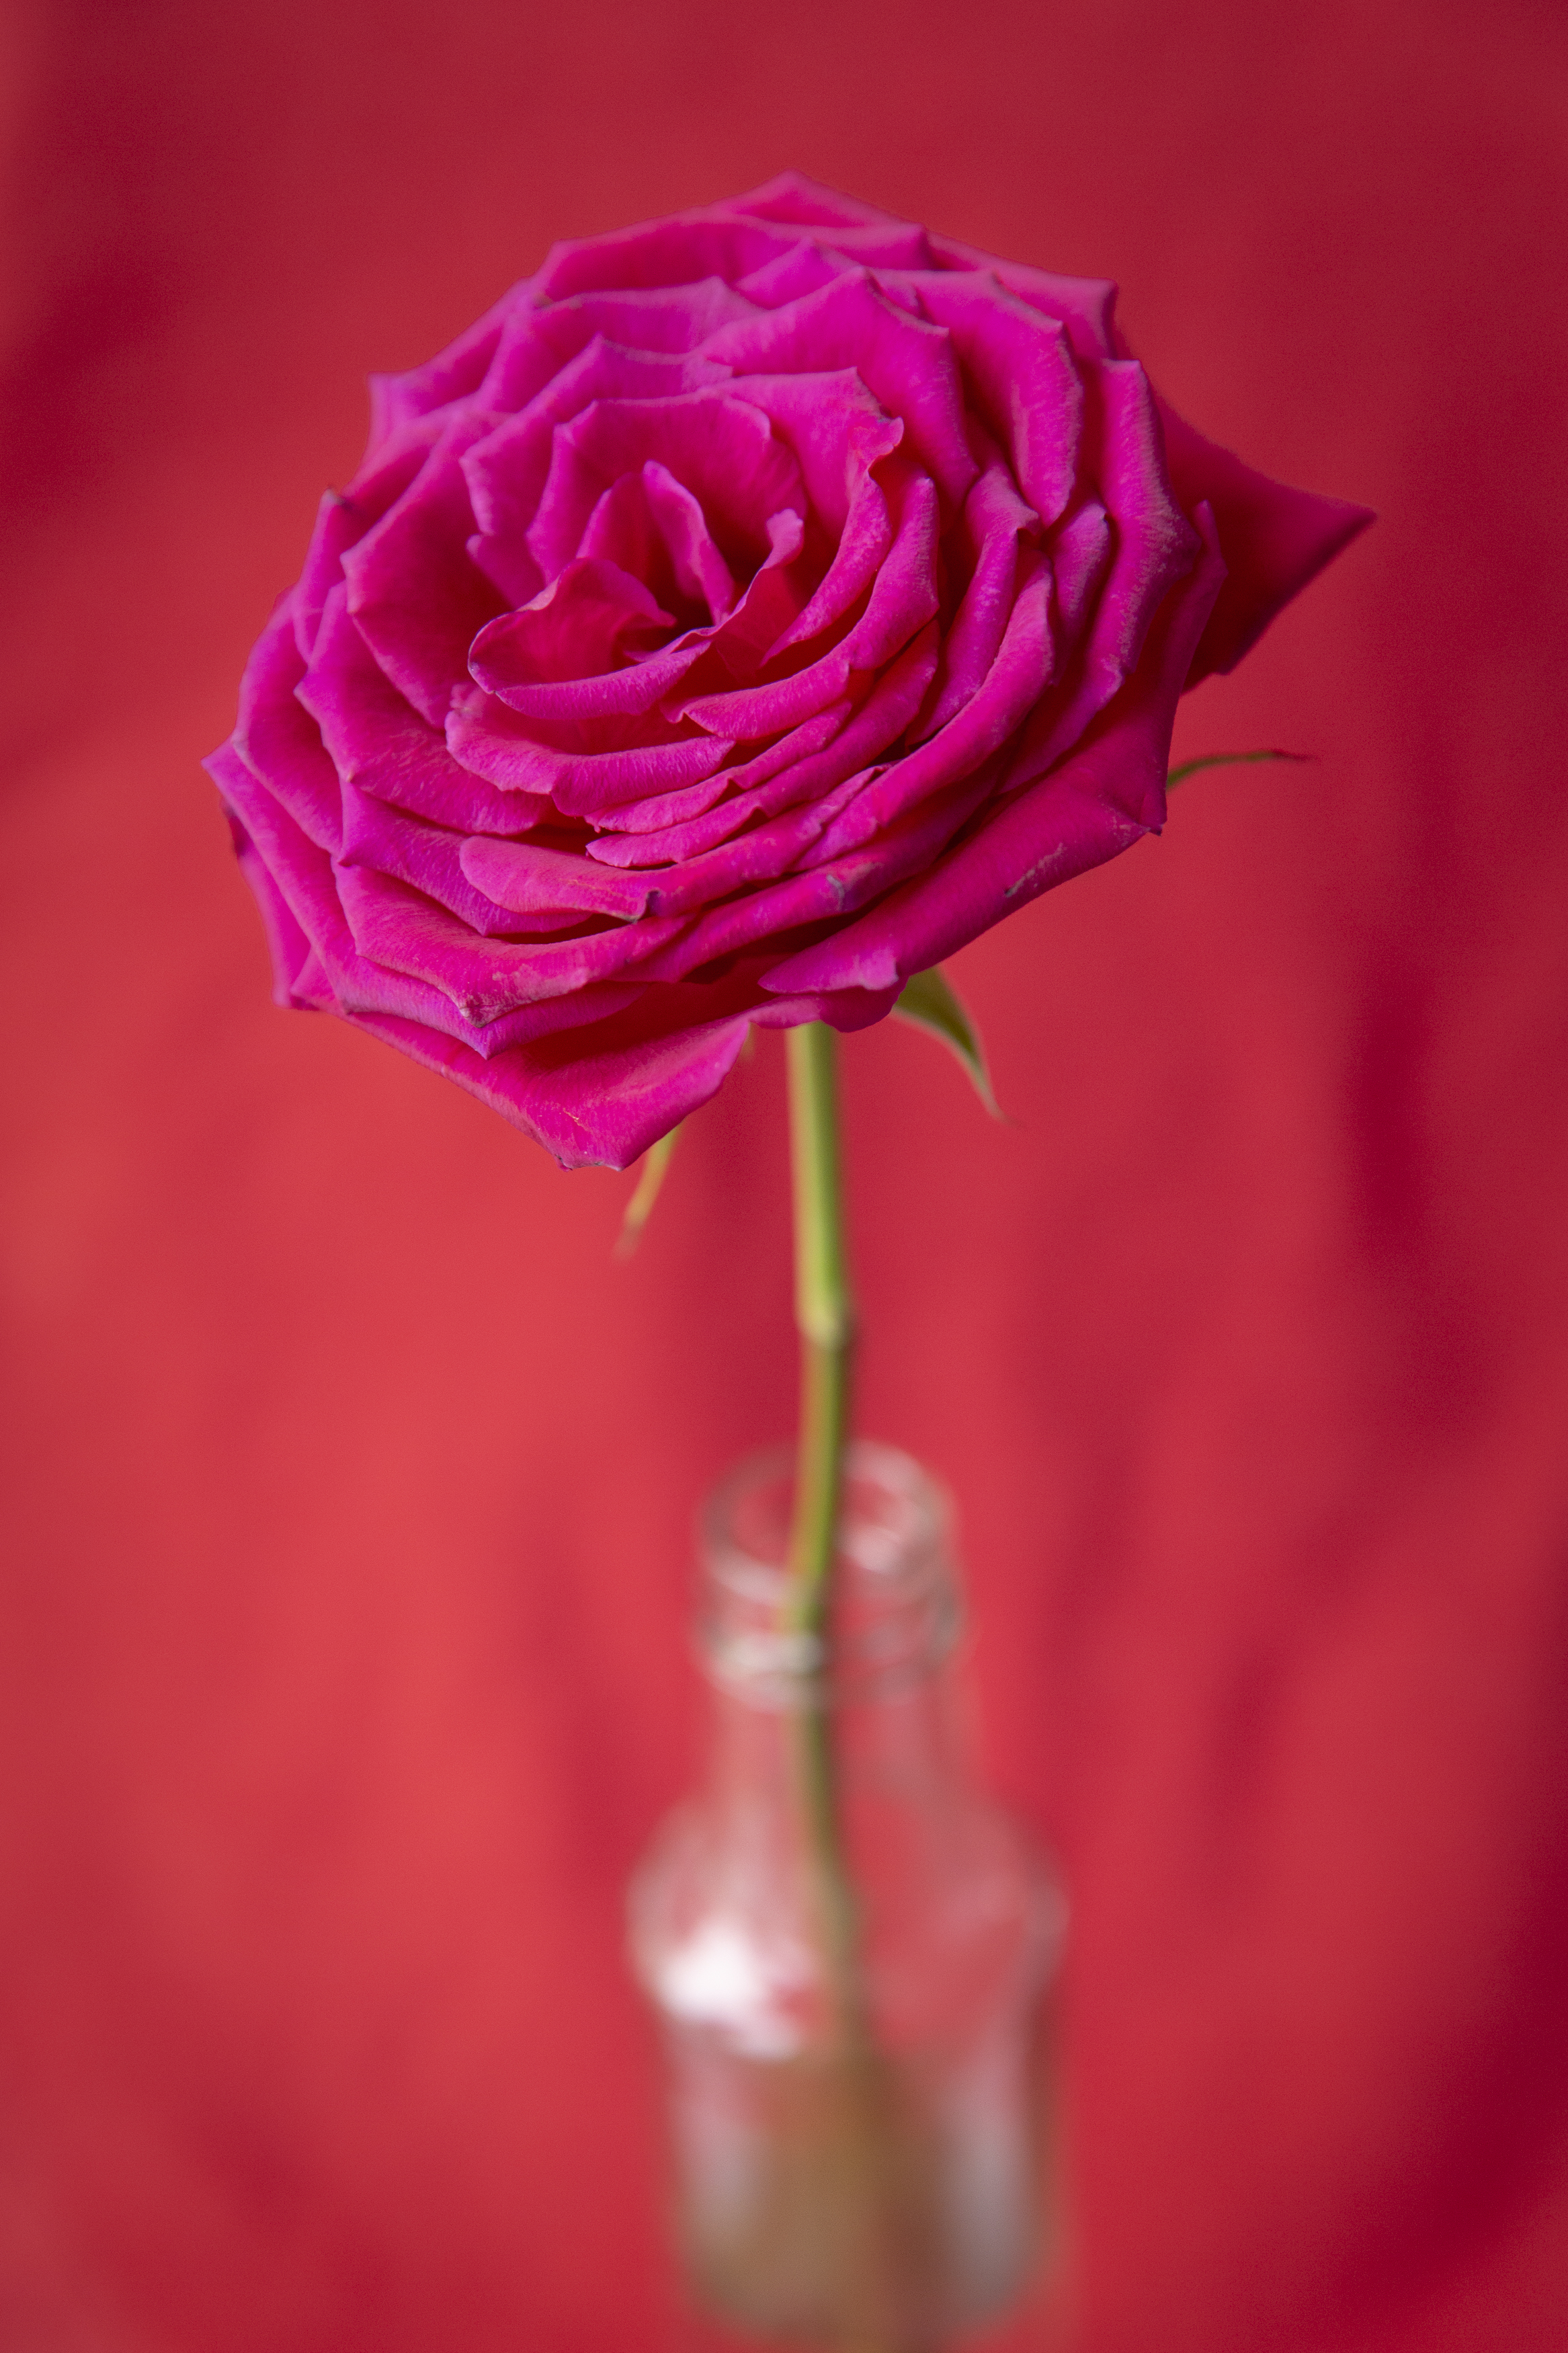
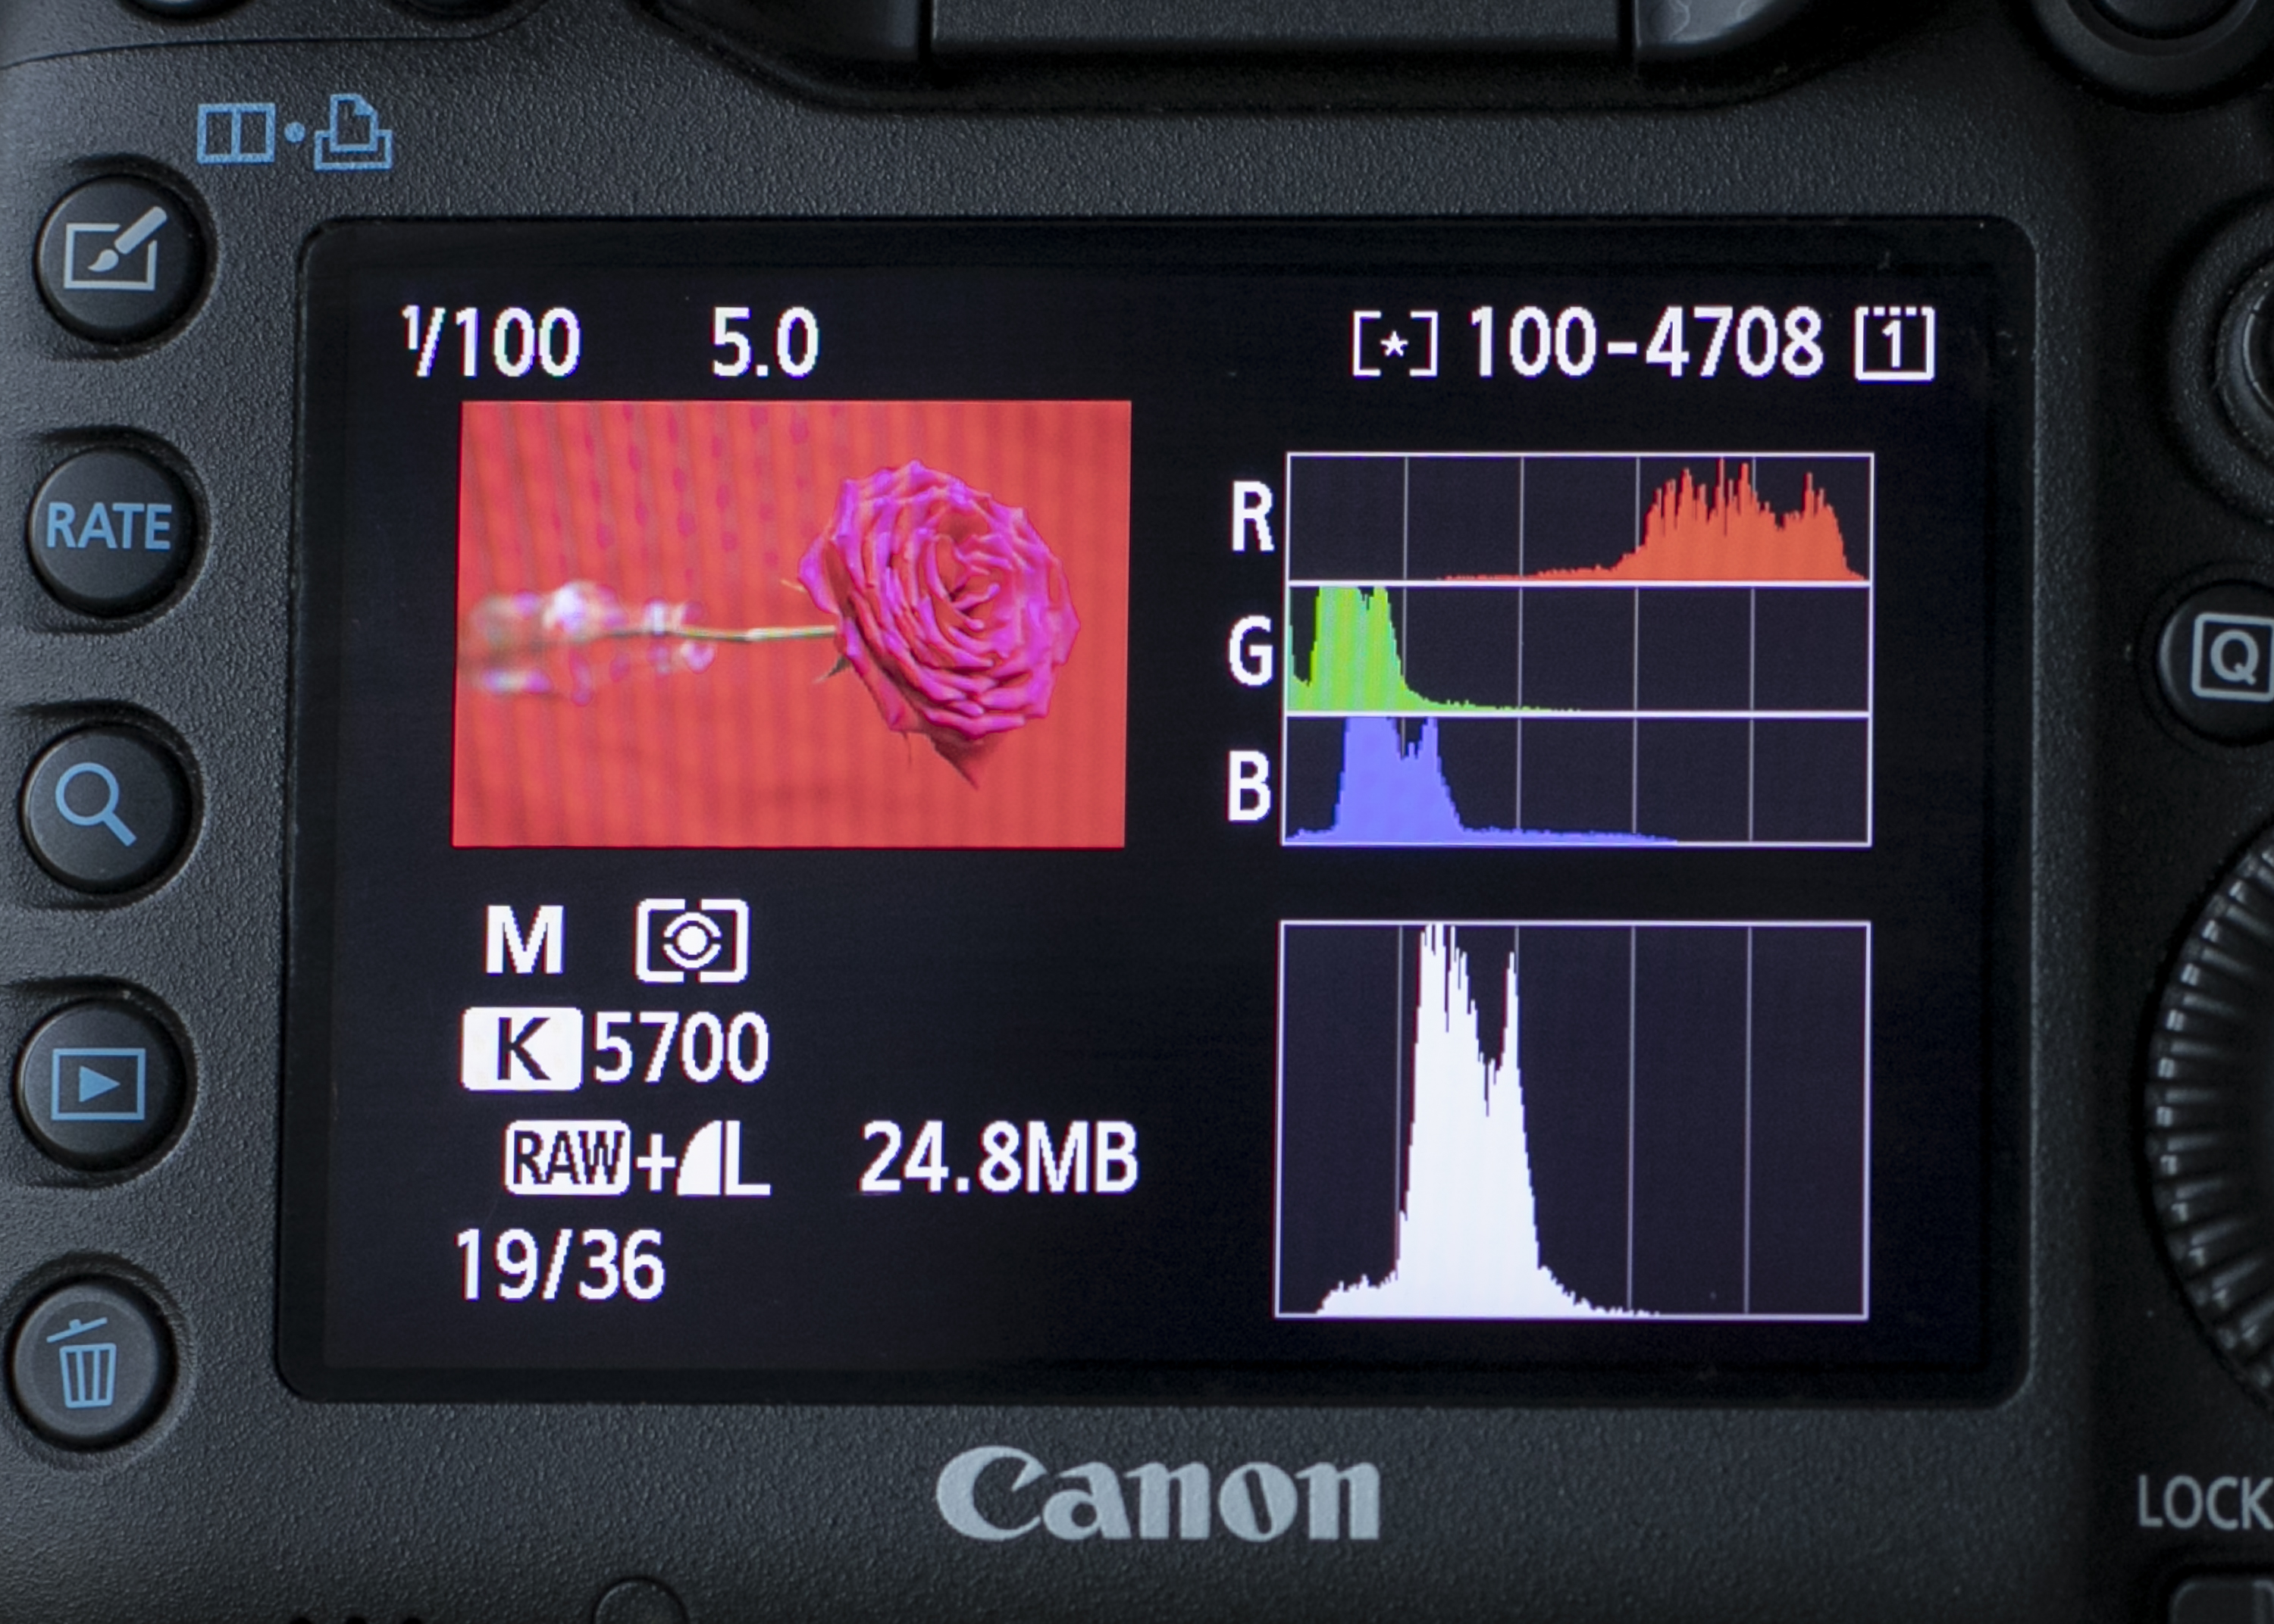
The Brightness histogram would suggest underexposed – but it’s on point, as the red channel shows tones far to the right.
7. Green backdrop
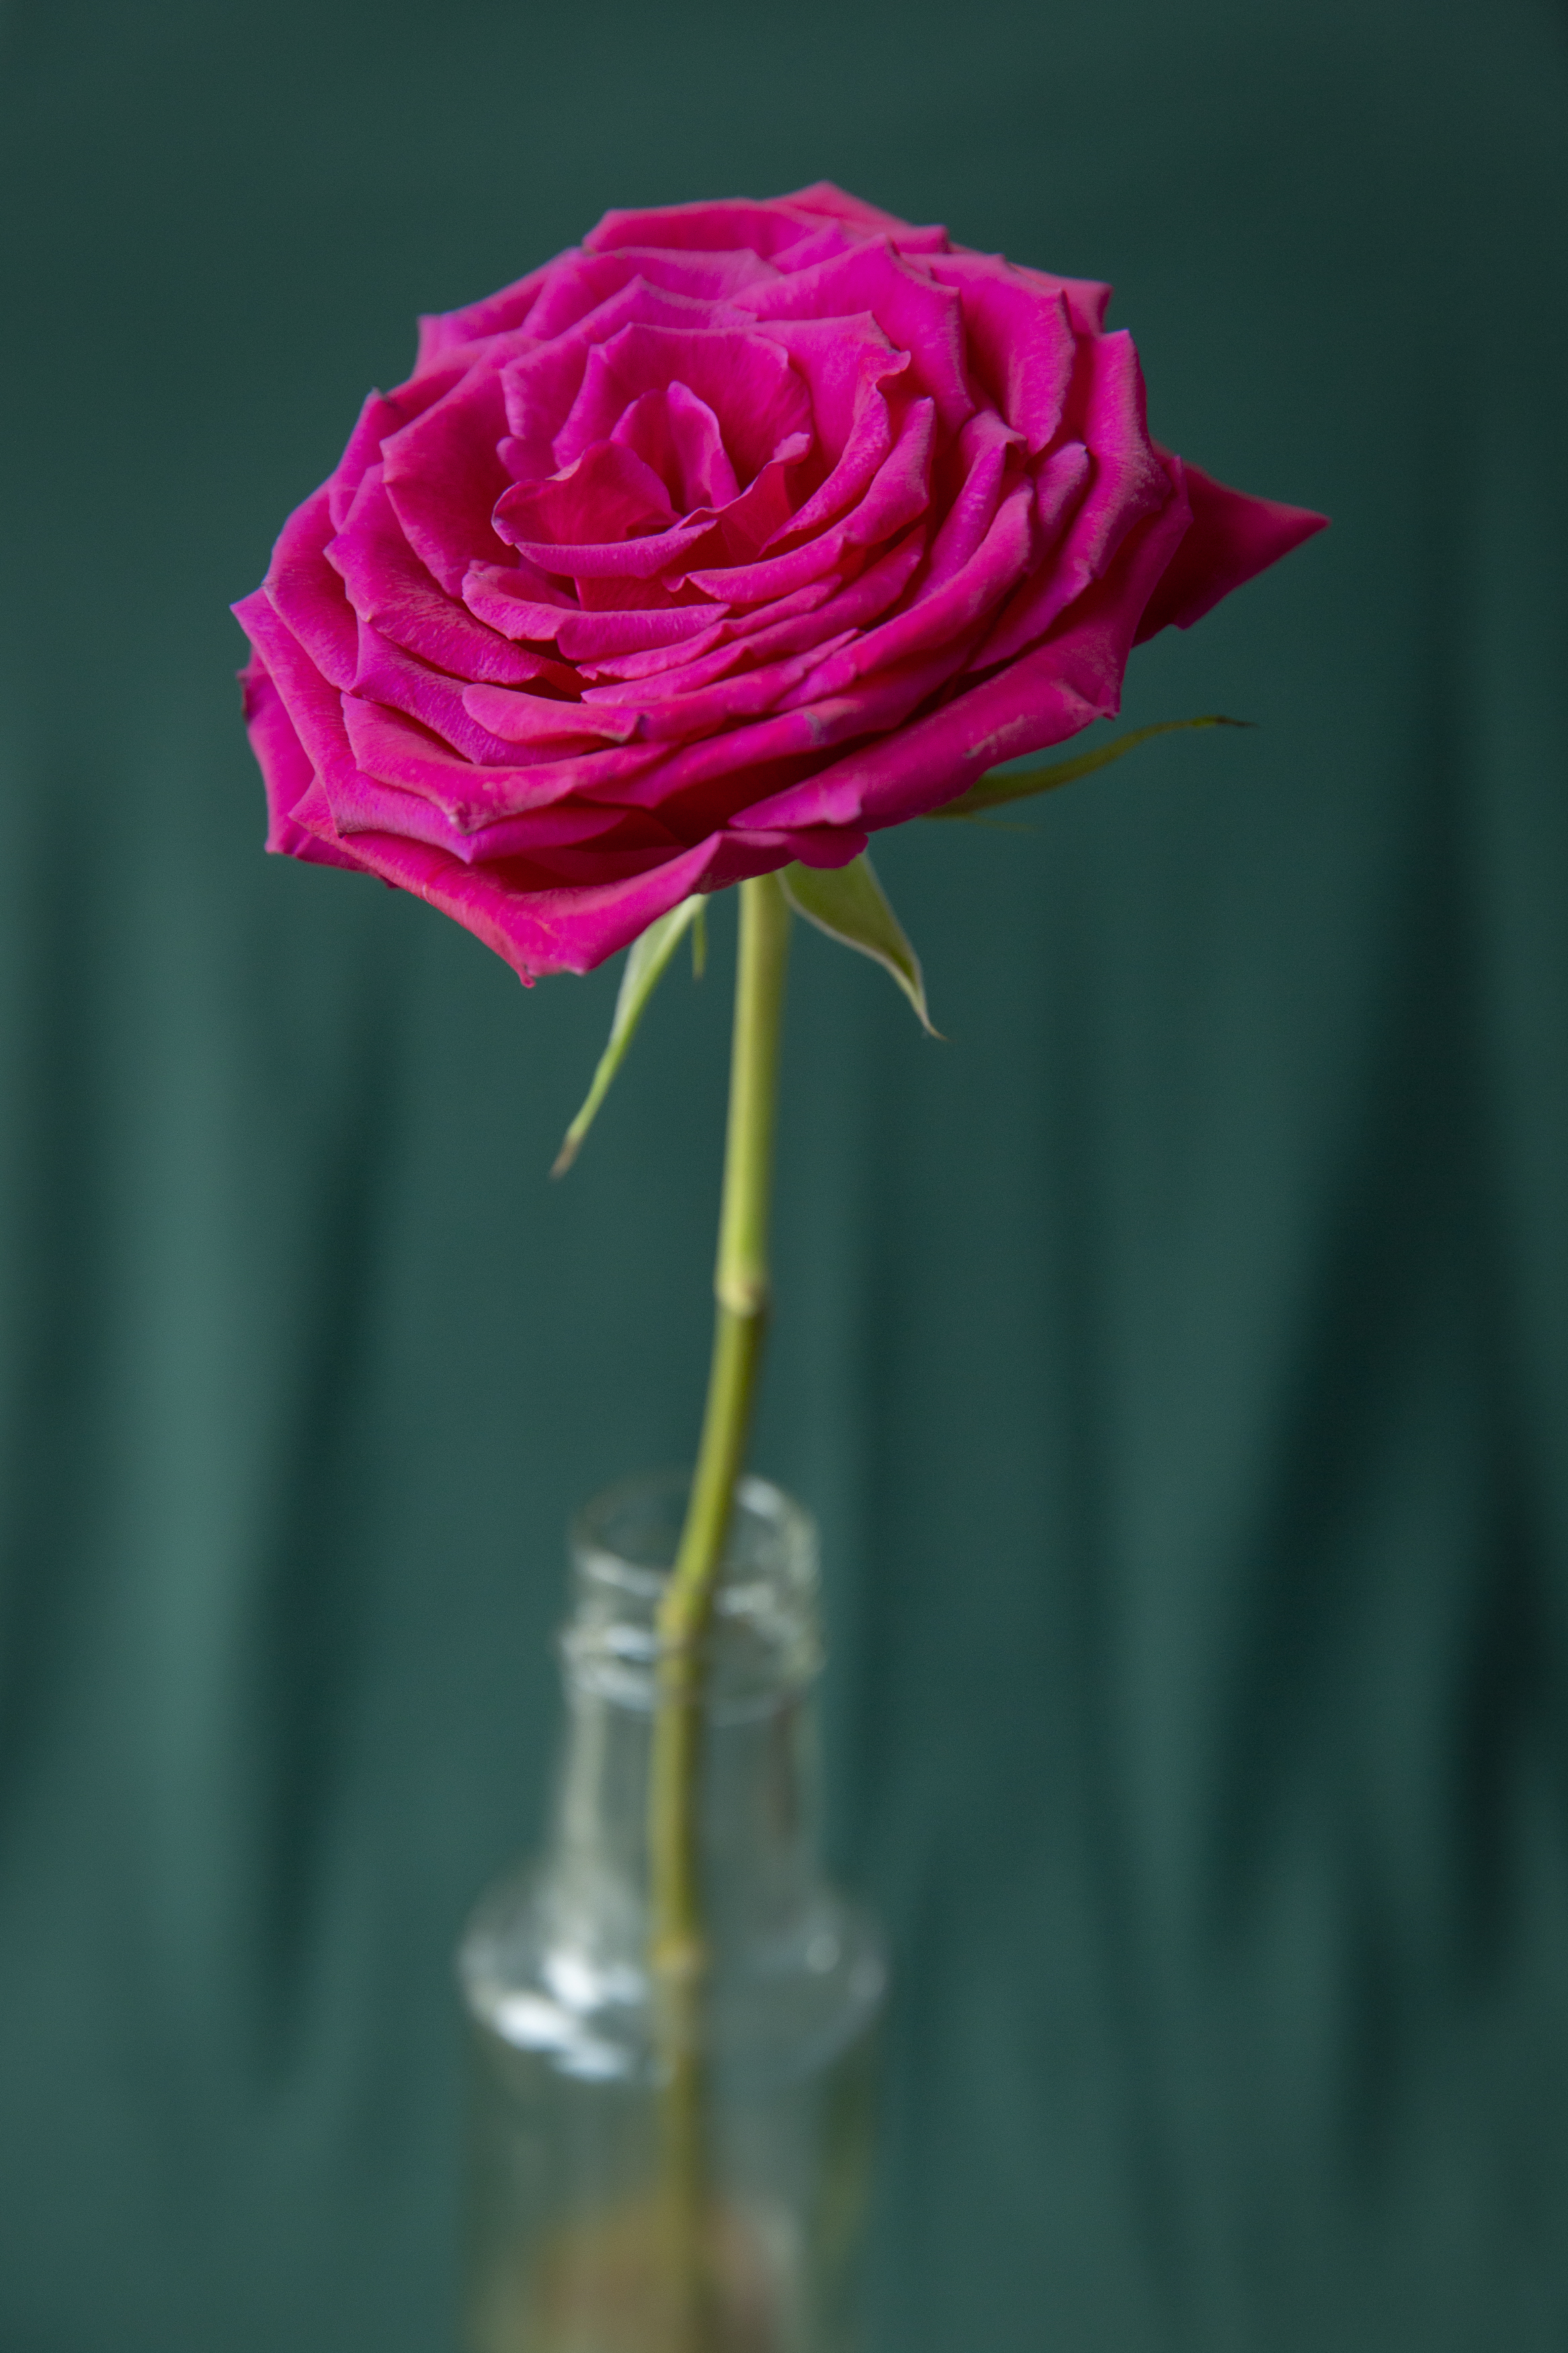
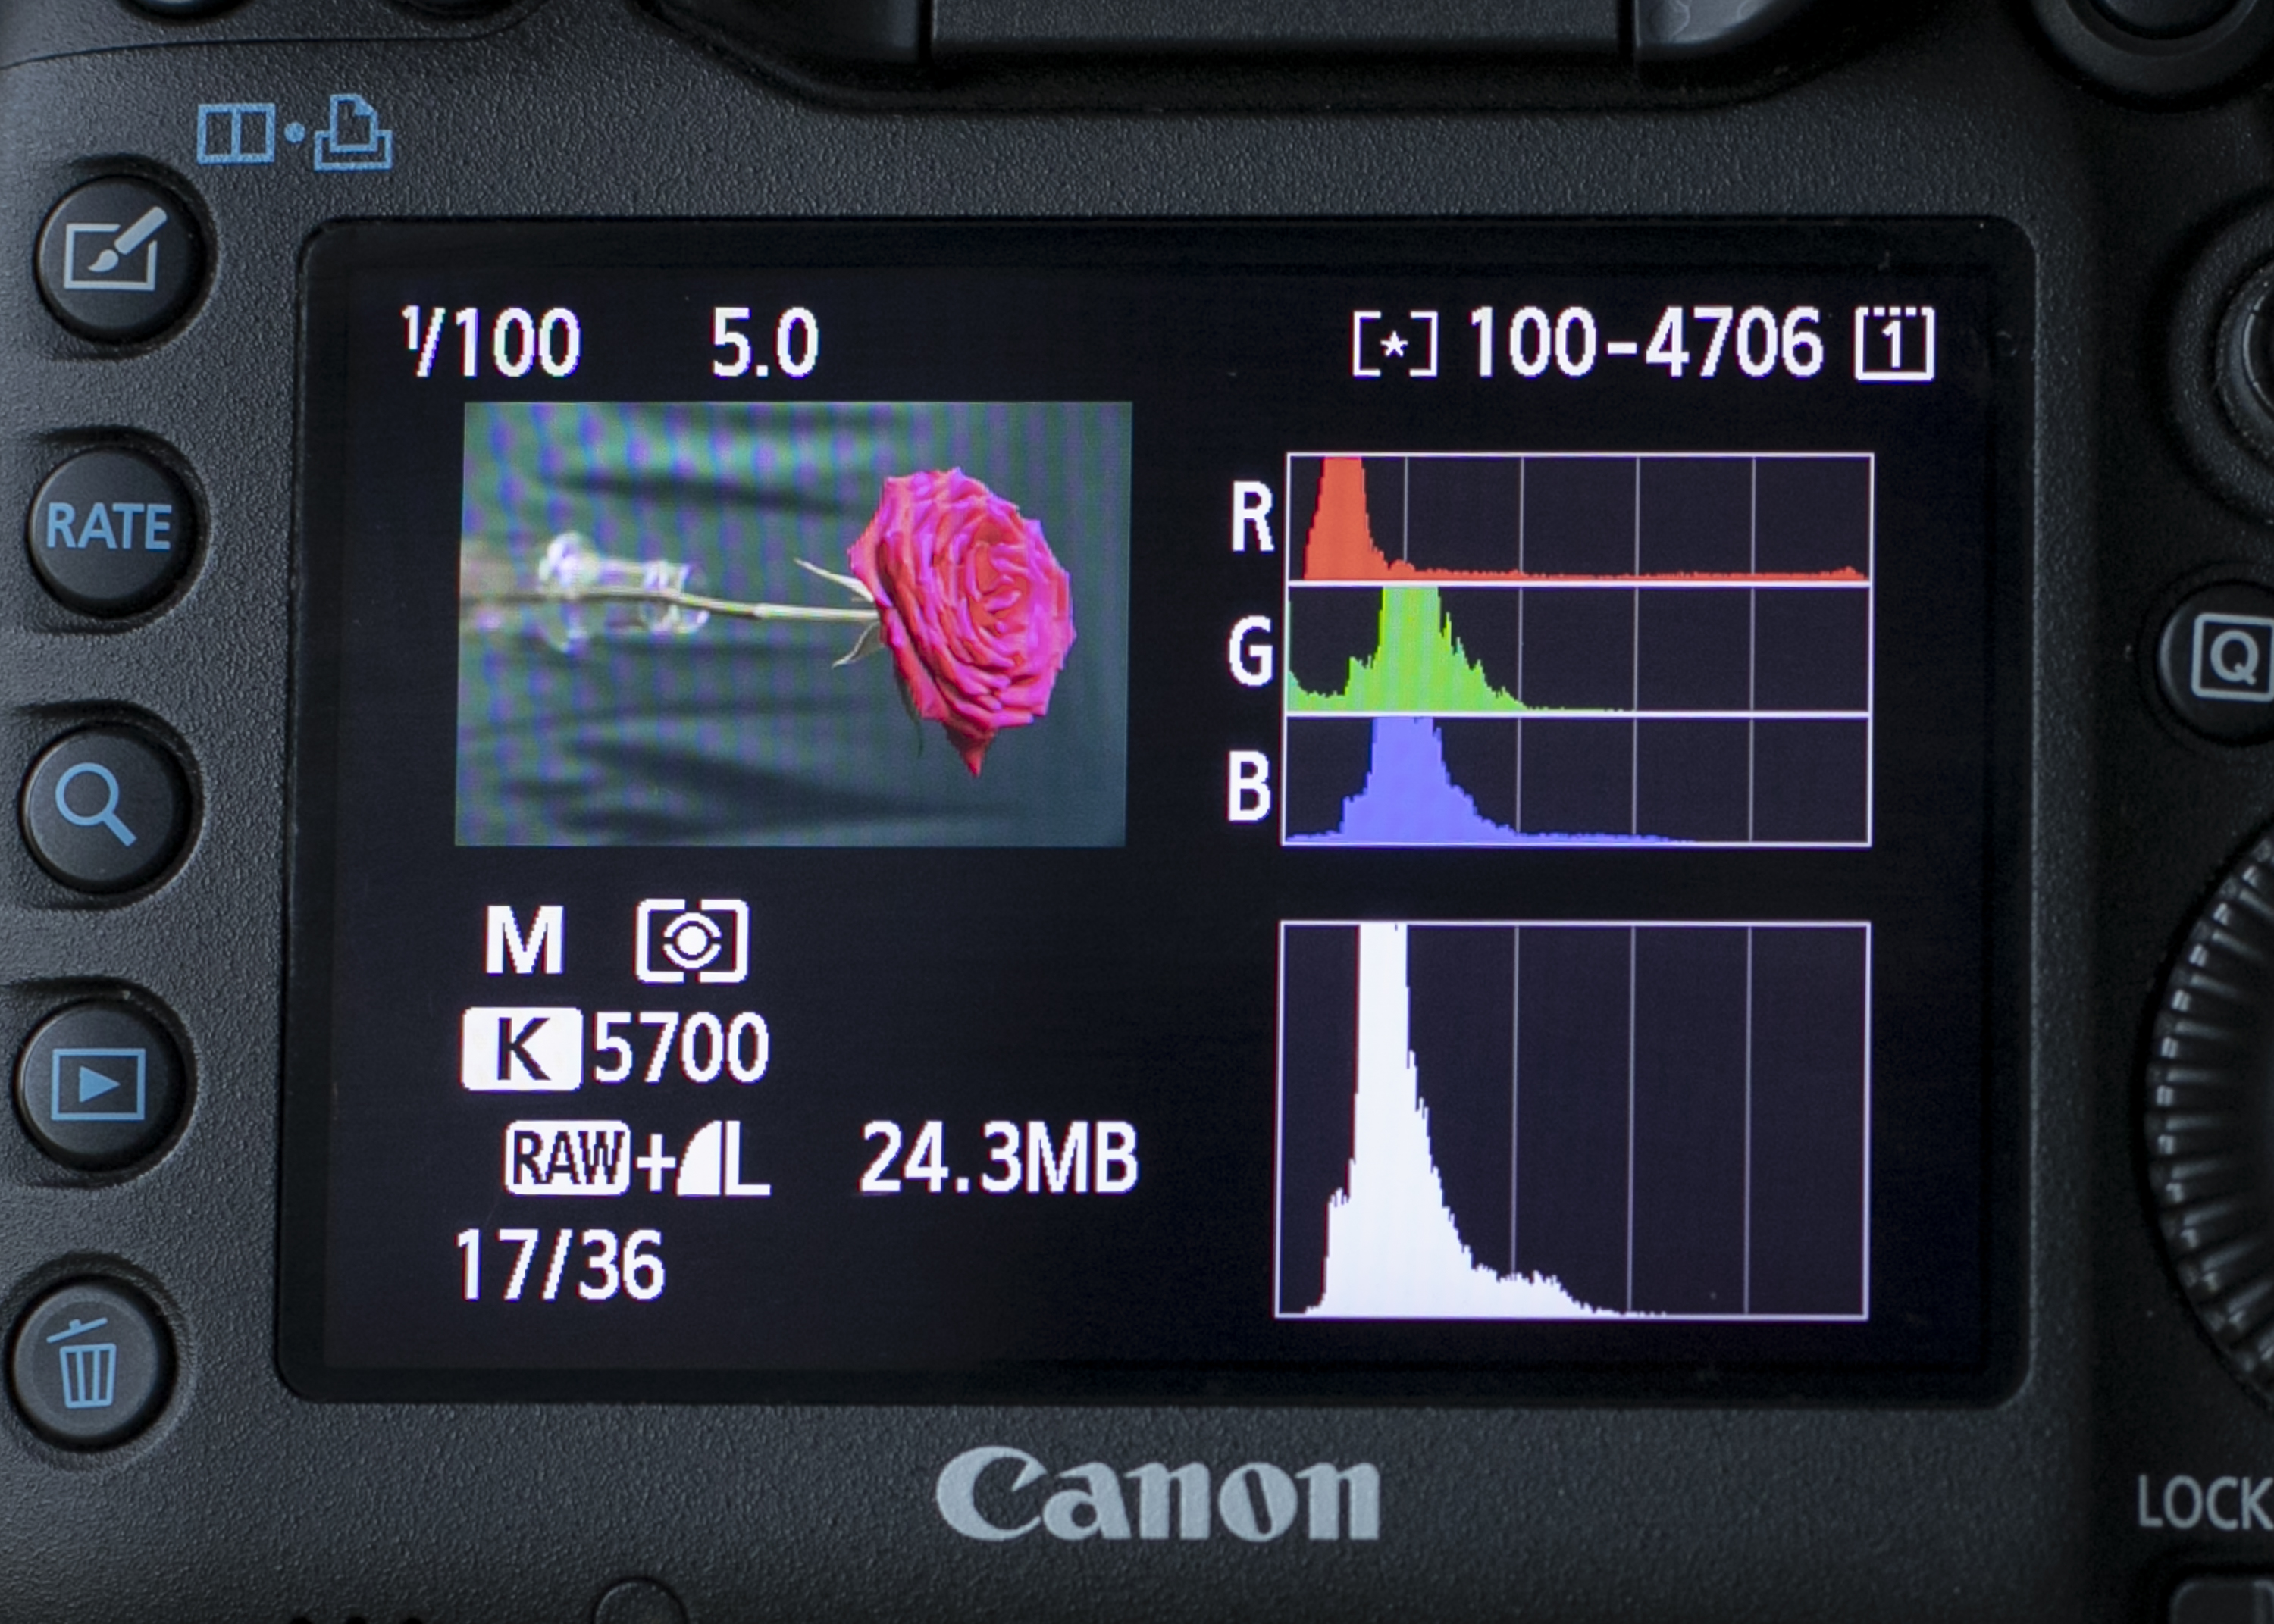
Again the Brightness histogram would suggest underexposure, but it’s actually spot-on as the red channel shows that the tones are not clipped.
8. Blue backdrop
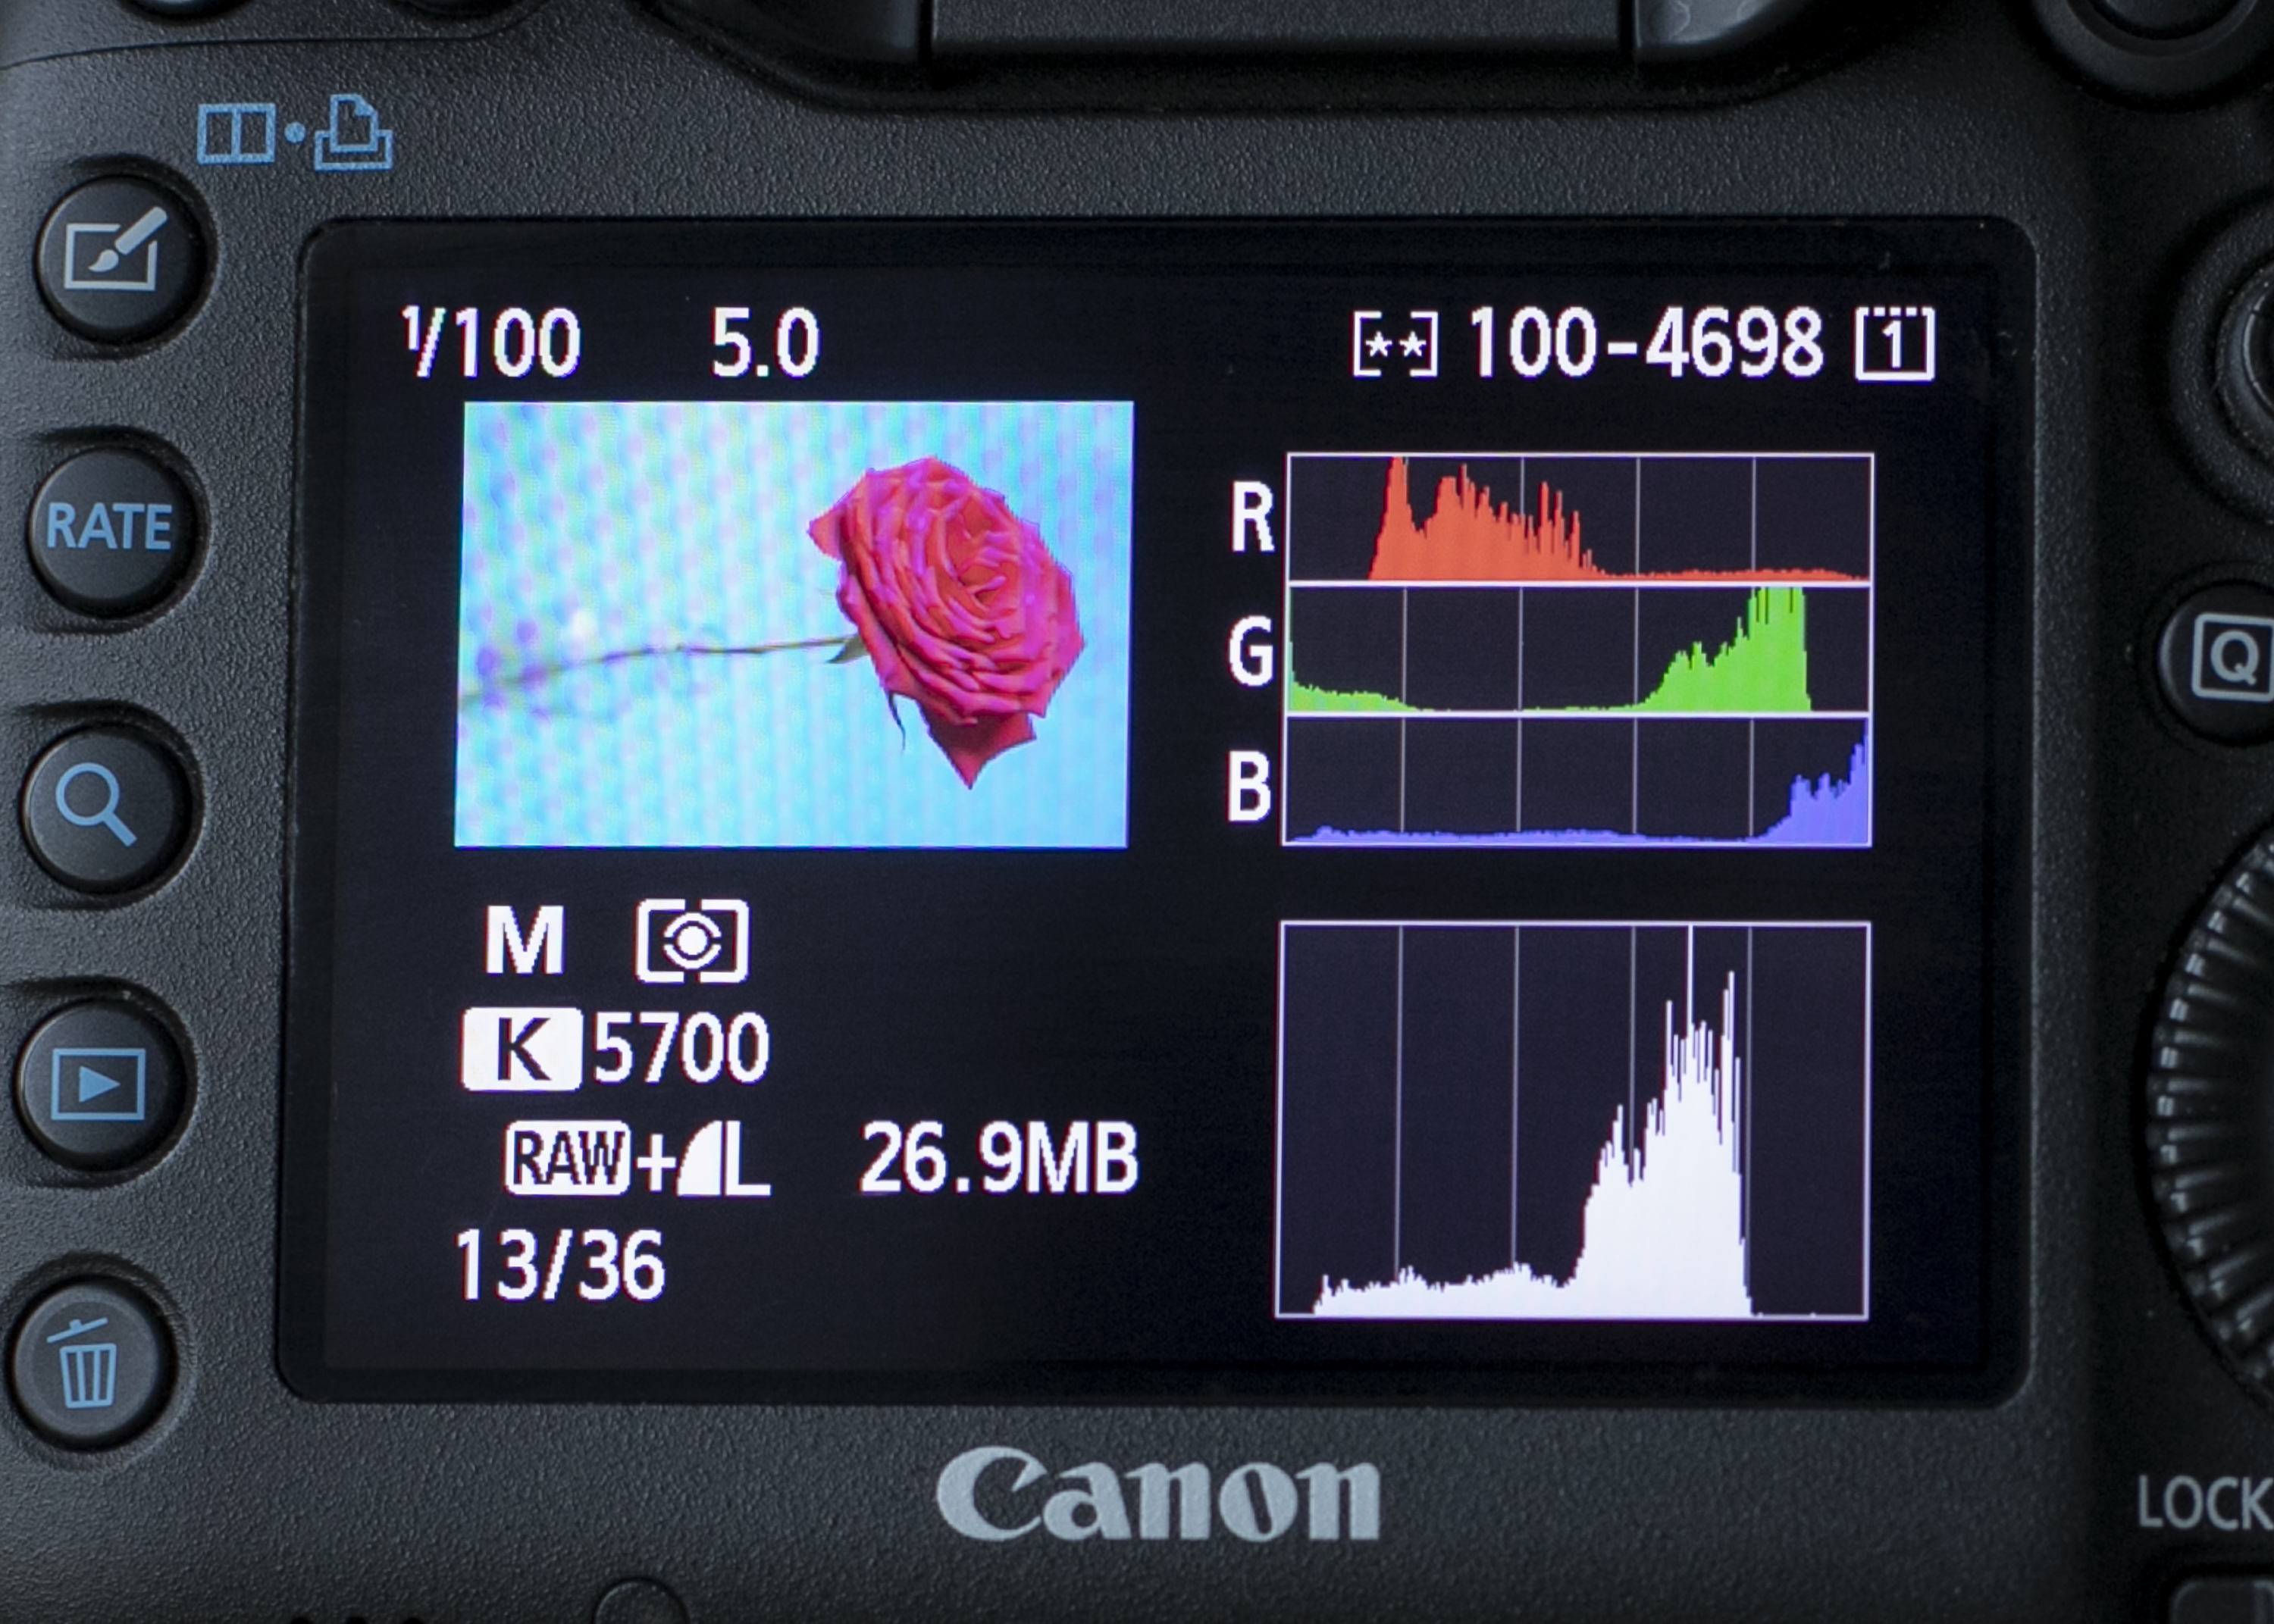
While the Brightness histogram that says it’s well exposed, with the blue background, the blue channel shows that tones are clipped off the right.
Read more:
Photography tips and techniques videos
Cheat Sheet: Histogram cheat sheet
Datacolor launches two new calibration kits with huge introductory discounts
The former editor of PhotoPlus: The Canon Magazine, Peter has 18 years of experience as both a journalist and professional photographer. He is a hands-on photographer with a passion and expertise for sharing his practical shooting skills. Equally adept at turning his hand to portraits, landscapes, sports and wildlife, he has a fantastic knowledge of camera technique and principles.
He is the author of several published photography books including Portrait Photographer's Style Guide, and The Complete Guide to Organising and Styling Professional Photo Shoots with fellow portrait pro Brett Harkness.
Peter remains a devout Canon user and can often be found reeling off shots with his Canon EOS DSLR and EOS R mirrorless gear. He runs Peter Travers Photography, and contributes to Digital Camera magazine.

